This is part of our series of blog posts on recent enhancements to Impala. The entire collection is available here.
Apache Impala is synonymous with high-performance processing of extremely large datasets, but what if our data isn’t huge? What if our queries are very selective? The reality is that data warehousing contains a large variety of queries both small and large; there are many circumstances where Impala queries small amounts of data; when end users are iterating on a use case, filtering down to a specific time window, working with dimension tables, or pre-aggregated data. It turns out that Apache Impala scales down with data just as well as it scales up. We’ll discuss the architecture and features of Impala that enable low latencies on small queries and share some practical tips on how to understand the performance of your queries. In this case, reducing runtime from 930ms to 133ms for nearly a 7x improvement.
Small queries are part of many common use cases:
- Financial summary reporting with the end of quarter or end of year results.
- Data science experiment result and performance analysis, for example, calculating model lift.
- Operational, Cybersecurity, and IoT reporting where the current point in time state of an individual or single device needs to be analyzed.
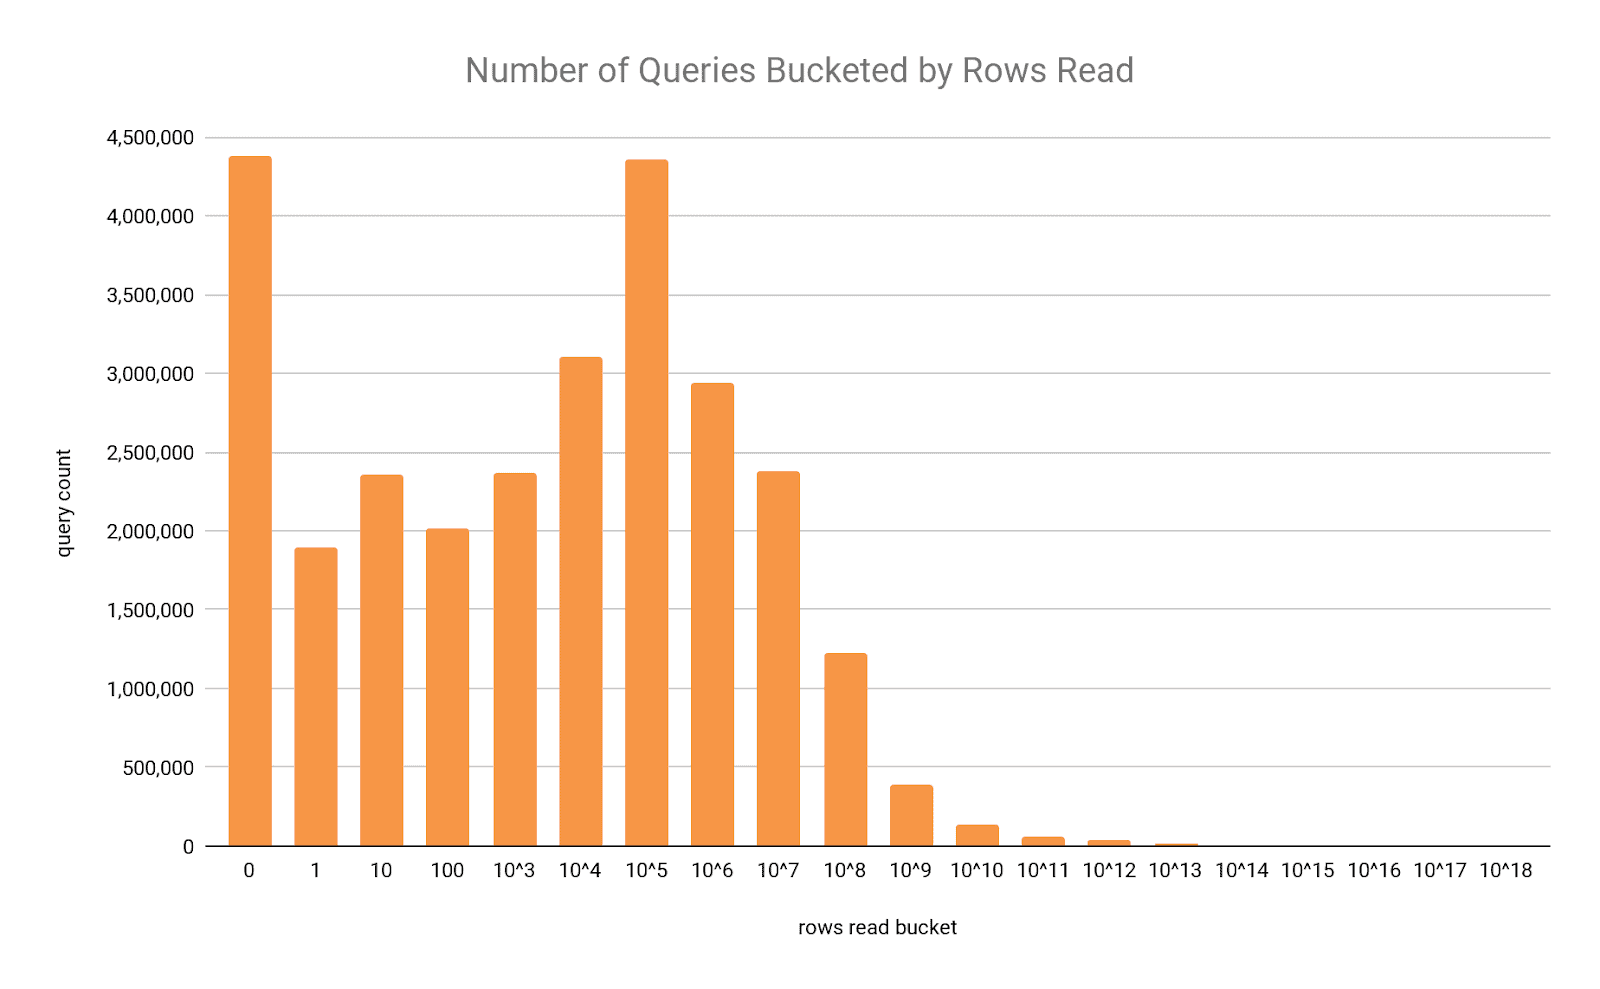
Below is a small anonymized sample of real user queries from various customers across the last 12 months totaling about 28 million data points. The x-axis is the log10 of the number of rows read in the query after partition pruning and index filtering has skipped potentially many more rows. About 31% of the queries, spread out across the first three buckets, read from 0 to 100 rows. Then again the 23 queries in the last three buckets read half as many rows as the rest of the 28 million queries combined. The first three buckets of queries where 100 rows or less were read, about a third of overall Impala usage, had a mean runtime of just under 300ms! So clearly Impala is used extensively with datasets both small and large.
Impala Optimizations for Small Queries
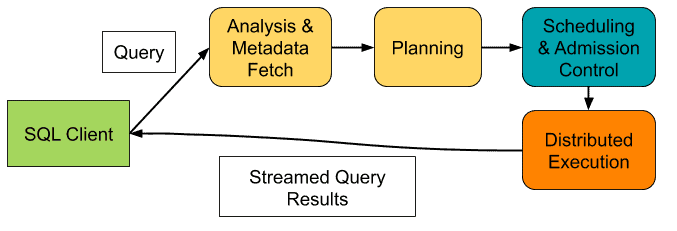
We’ll discuss the various phases Impala takes a query through and how small query optimizations are incorporated into the design of each phase. It helps to have an understanding of the “life of a query” as illustrated in the diagram below. Once a query is submitted from a client the first two phases broadly constitute query compilation, then if enough resources are available it is admitted and scheduled across the cluster and finally executed. For a more in-depth description of these phases please refer to Impala: A Modern, Open-Source SQL Engine for Hadoop.
Query Planner Design
Impala is architected to be the Speed-of-Thought query engine for your data. Query optimization in databases is a long standing area of research, with much emphasis on finding near optimal query plans. The commonly-accepted best practice in database system design for years is to use an exhaustive search strategy to consider all the possible variations of specific database operations in a query plan. The problem of query optimization has been shown to be one of a class of problems in computer science that are called NP-Hard, which means finding an optimal solution can take a very long time. Unlike most traditional SQL databases, Impala eschews these exhaustive search query optimization strategies to simplify query planning. This is an emerging trend adopted by several database systems including Google’s F1 and Youtube’s Procella, which take a similar non-exhaustive approach to query optimization. This means that small queries can be planned quickly, avoiding situations where it takes longer to plan a query than to execute it. Impala’s planner simplifies planning in several ways.
- Unlike traditional planners that need to consider accessing a table via a variety of types of index, Impala’s planner always starts with a full table scan and then applies pruning techniques to reduce the data scanned. With modern hardware and an optimized execution engine, simple table scans executed as close to the storage layer as possible are always a viable execution strategy, especially with open columnar file formats like Apache Parquet
- Impala does not consider all possible join orderings, focusing instead on the subset of left deep join plans. This usually means joins are arranged in a long chain where the left input is preferred to be larger than the right input. Left deep join plans can be constructed very quickly and result in lots of potential for pipelining and parallelism during execution. Pipelining is critical for taking advantage of modern CPU and memory architectures.
- Impala’s planner does not do exhaustive cost-based optimization. Instead, it makes cost-based decisions with more limited scope (for example when comparing join strategies) and applies rule-based and heuristic optimizations for common query patterns. Exhaustive cost-based query planning depends on having up to date and reliable statistics which are expensive to generate and even harder to maintain, making their existence unrealistic in real workloads. Research has shown that, when statistics are unreliable, exhaustive optimizers can spend a lot of time planning queries and still produce very bad plans.
- While plan time statistics are unreliable, an execution engine that adapts in real-time based on actual data means that the right optimization can be applied dynamically when the query seems to be taking longer than it should. More on this below.
Metadata Caching
If you have ever interacted with Impala in the past you would have encountered the Catalog Cache Service. This is used to provide very low latency access to table metadata and file locations in order to avoid making expensive remote RPCs to services like the Hive Metastore (HMS) or the HDFS Name Node, which can be busy with JVM garbage collection or handling requests for other high latency batch workloads. As with most caching systems, two common problems eventually arise: keeping the cache data up to date, and managing the size of the cache. As Impala’s adoption grew the catalog service started to experience these growing pains, therefore recently we introduced two new features to alleviate the stress, On-demand Metadata and Zero Touch Metadata.
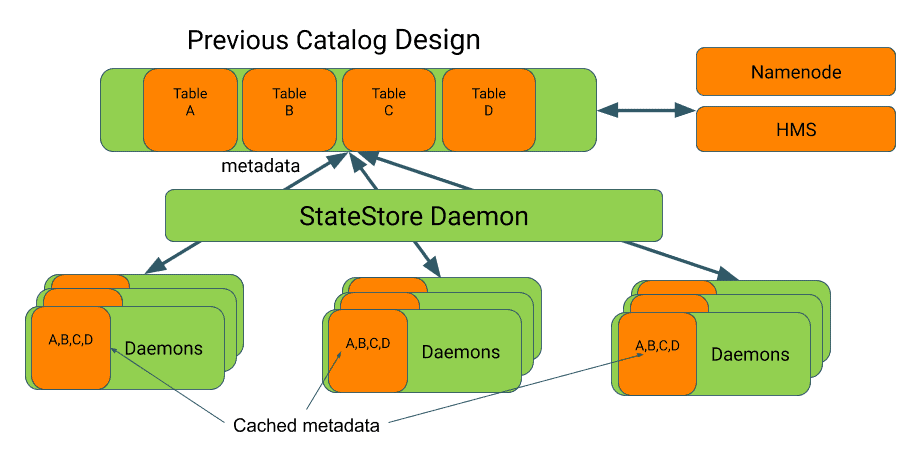
In the previous design each Impala coordinator daemon kept an entire copy of the contents of the catalog cache in memory and had to be explicitly notified of any external metadata changes.
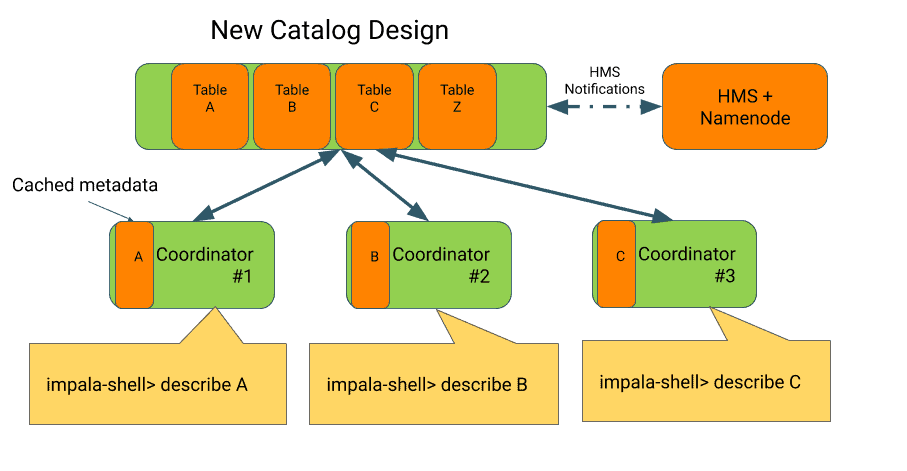
The new Catalog design means that Impala coordinators will only load the metadata that they need instead of a full snapshot of all the tables. A new event notification callback from the HMS will inform the catalog service of any metadata changes in order to automatically update the state. See the performance results below for an example of how metadata caching helps reduce latency.
Execution Engine
Apache Impala has always sought to reduce analyst time to insight, and the entire execution engine was built with this philosophy at heart. The execution engine is entirely self-contained in a single stateless binary and doesn’t depend on a complex distributed framework like MapReduce or Spark to run. Even though there are services like the Catalog Cache described above, what most people don’t realize is that it is all started from the same single binary.
C++ and LLVM: Since there aren’t multiple layers of compute frameworks between the user and the Impala engine, the process of handling query requests is not dependent on resources being spun up. The Impala daemons, or impalads, are always standing by to start executing queries – they can take a query plan and start processing data within milliseconds. The execution engine has a novel approach of embedding a JVM and using Java for working with the broader ecosystem, but then executing all performance-sensitive operations through a C++ based core. Furthermore, when possible it uses LLVM to compile repetitive operations directly to machine code for the specific characteristics of the data rows being worked on. This means Impala not only runs fast, but it also responds fast!
Memory-optimized: When processing the data, Impala tries to perform everything in-memory, going so far as optimizing for CPU caches and not just memory in DRAM. With the plentiful amounts of RAM on modern servers, the vast majority of queries can be executed entirely in memory, avoiding bottlenecks like disk I/O operations. This doesn’t mean Impala is in-memory only; if memory is running low for a query, various memory-conservation strategies kick in, including spilling intermediate query results to disk. Thus very memory-intensive queries can run to completion, but other queries do not pay any performance penalty.
Streaming pipeline operators: With the bias of data being in memory we’d also like to be able to do as many operations on it as possible while it’s in memory. For this reason, Impala also implements a streaming pipelined execution model. This means that at any given time, more than one part of the query is executing at the same time on different parts of the data. Think of this more like an assembly line where the rows of data move from one worker to another, and each worker is an expert focused on their specific part of the job. In contrast to each worker getting their widget and assembling the entire product from start to finish. This allows us to build potentially very long “assembly lines” of processing that can handle some complex multi-part queries without sudden stalls or pauses, versus the worker who would have to remember all the steps for assembly themselves. In addition, this actually reduces memory requirements – data keeps moving through the pipeline until it can be filtered out, returned to the client, or aggregated, and does not accumulate at each step of processing.

Adapting at Runtime
It’s possible to spend more time preparing and planning to execute a query than it might take to actually execute it, as discussed above. Making the right decision in this tradeoff becomes critical when keeping small queries fast, as it avoids having a uniform penalty across all queries. Instead, Impala supports adaptive execution. As a query continues to execute and it seems as though it will take longer and longer to run, we can dynamically adjust or enable some optimizations that may have otherwise incurred an overhead if the query had already completed. This is especially helpful in real-world situations mentioned above where we can’t rely on up to date statistics or assumptions about the uniqueness of the data.
Runtime Filtering: When performing a join between two tables, any rows from one table that don’t match the join condition in the other table aren’t returned by the join operation. However before those rows get to the join operation they have to be read from storage and materialized in memory, just to be later discarded by the join. Runtime filtering is a technique to dynamically determine which rows would definitely not meet the join criteria and avoid bringing them to the join node in the first place. This technique is also used heavily by recent versions of Microsoft’s SQL Server and UW’s Quickstep. The research from these groups has provided a formal proof that a lightweight query optimization approach combined with careful placement of runtime filters will produce more optimal query plans in linear time as compared to a more complex query optimizer for the space of queries that follow a star or snowflake schema design!
Streaming Pre-aggregation: In the case of distributed query execution it tends to be more efficient to break steps into two parts where you apply one part before transmitting data over the network to reduce the amount needed to transmit and the second part after receiving data over the network. One such example of this is aggregating along an attribute, however in the case where the attribute is fairly unique it doesn’t make as much sense to do the work twice in each part. So in this case Impala attempts to automatically detect a situation where more CPU time would be wasted applying the aggregation twice versus the time saved with the reduced network payload. This behavior can be controlled with the DISABLE_STREAMING_PREAGGREGATIONS query option.
Code Generation: Impala’s “codegen” feature provides incredible performance improvements and efficiencies by converting expensive parts of a query directly into machine code specialized just for the operation of that particular query. However this works a lot like compiling code for a programming language like C or C++, there is some time spent compiling the code before it can be used. This overhead upfront could be dramatically worthwhile when that code is going to be executed many thousands of times for each row of processed data. Compiling small chunks of a query directly with LLVM is a lot more efficient than compiling a full C or C++ program, but still takes 10s or 100s of milliseconds., For a query that isn’t accessing many rows, the compilation overhead can outweigh the benefits. Impala is aware of this tradeoff and tries to intelligently enable “codegen” based on the amount of data being accessed. We also recently added the ability for this compilation to take place asynchronously, so that the query can start producing results even before compilation is complete.
Tips for Your Queries
Now I’m sure that you’re convinced that Impala has been architected to give you great performance for queries both small and large. But how can we verify we’re getting the best possible short query performance and what options do we have to make it even better? In the case of short queries, you’ll find that you want to pay attention not only to how much time was spent actually executing operations over the data, but also in preparation and planning the query before execution.
Reading a Query Profile
We’ll illustrate with an example. In this case, we’ve picked Query #3 from the TPC-H Benchmark, available here in case you’d like to try it for yourself. We wanted a realistic query and workload to test with but also wanted to focus on queries not accessing very many rows. Therefore we used a scale factor of 1 to load the data and modified the query’s filter to be a bit more restrictive; the original query on Parquet tables would read about 10M rows. The query involves joining a fact table with two dimension tables in a typical star schema manner, then it aggregates across three columns and computes an aggregate measure. The results are ordered and limited to the top 100. Definitely not a simplistic query, but one which has a pattern common in BI types of workloads.
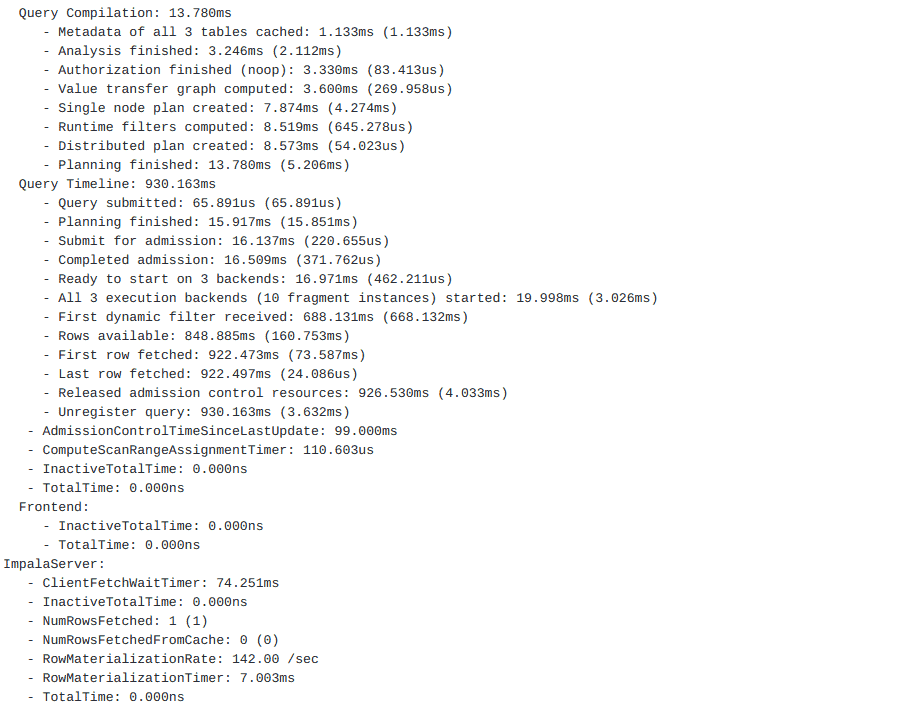
A query profile is a detailed recap of the performance and runtime of various parts of query execution. A query profile can be obtained after running a query in many ways by: issuing a PROFILE; statement from impala-shell, through the Impala Web UI, via HUE, or through Cloudera Manager. Our query completed in 930ms.Here’s the first section of the query profile from our example and where we’ll focus for our small queries.
Query Compilation
The first section on query compilation covers the time for preparing and planning the query. This includes the time to fetch the metadata and schema for our tables. As we discussed previously, Impala tries to cache and optimize this metadata.
Query Compilation: 13.780ms
- Metadata of all 3 tables cached: 1.133ms (1.133ms)
- Analysis finished: 3.246msms (2.112ms)
To show the benefit of the Catalog Cache we issued an invalidate statement to flush the cached metadata for each of our tables and reran the query to measure the time to fetch the data directly from the Hive Metastore. In this case it took 4s compared to the 13ms from above.
Query Compilation: 4s170ms
-Metadata load started: 1.086ms
- Metadata load finished. load-tables=3/3 load-requests=1 catalog-updates=5 storage-load-time=12ms: 4s155ms (4s154ms)
- Analysis finished: 4s158ms (2.205ms)
Let’s drill into some of the other parts of the Query Compilation process:
- Value transfer graph computed
- Analysis finished
High wait times in these areas might mean there are many columns or expressions to analyze, and this can happen especially when many logical views exist with 100s of columns defined in the view but not necessarily used in the query. The query option ENABLE_EXPR_REWRITES can be used to reduce the number of passes over these columns in cases where the Analysis time appears high.
- Authorization finished
Large values here indicate latency issues with authorization and permission checks, this can mean issues with Apache Sentry or Apache Ranger. In some cases it may indicate a problem looking up user group information from LDAP or the local directory provider.
- Single node plan created
- Distributed plan created
A single node plan is the simplest possible execution strategy for a given query. In order to convert this simple form into a distributed plan multiple optimization passes are run over the query plan. Having many joins, logical views, or inaccurate table statistics can slow this process down. If you noticed large delays here and your statistics are up to date or reducing the numbers of tables in the query is not an option, consider adding planner hints to the query. This will skip certain optimization steps and instead directly follow the provided hint.
Query Timeline
This section covers the time spent on various aspects of the runtime of the query after planning is complete.
- Submit for admission
- Completed admission
Long wait times for admission has to do with any admission control and queuing policies that have been configured to manage multiple concurrent users.
- Ready to start on 3 backends -
All 3 execution backends (10 fragment instances) started
Any large time difference at this point represents the overhead of initializing and starting distributed execution across the cluster. There are inherent network communication latencies with contacting all the nodes and ensuring they are ready to process the query. For certain types of small queries it may be more beneficial to execute the query on a single node and bypass the communication overhead if it is close to the total execution time of the query, we’ll discuss how this can be done automatically or explicitly with the NUM_NODES option below.
- First dynamic filter received
- Rows available
- First row fetched
A large gap between the “Rows available” time and “First row fetched” time usually signifies issues with the client that submitted the query not requesting the results in a timely manner.
- Last row fetched
- Released admission control resources:
- Unregister query
Now that we understand some of Impala’s low latency query performance enhancements and how to read profile output, let’s take a look at our example query again. Originally our query completed in 990ms. Since this is a short query and we think we might be able to do better we can rely on Impala’s automatic short query optimization ability to disable some optimization features when we know the query will not read many rows. In particular the default threshold for this is set to 500 rows, we can increase it in our case to see how it helps:
| SET EXEC_SINGLE_NODE_ROWS_THRESHOLD=2000; |
Here’s the query timeline time now:
Query Timeline: 330.150ms
       - Query submitted: 36.853us (36.853us)
       - Planning finished: 10.875ms (10.838ms)
       - Submit for admission: 11.143ms (267.863us)
       - Completed admission: 11.440ms (297.235us)
       - Ready to start on 1 backends: 11.765ms (325.387us)
       - All 1 execution backends (1 fragment instances) started: 13.344ms (1.578ms)
       - Rows available: 317.090ms (303.745ms)
       - First row fetched: 326.258ms (9.168ms)
       - Last row fetched: 326.300ms (42.329us)
       - Released admission control resources: 328.305ms (2.004ms)
       - Unregister query: 330.150ms (1.845ms)
As you can see we have the query runtime down to 330ms! This setting uses some estimated data statistics to determine if a query will only read enough rows to stay below the threshold, in which case it will disable code generation and only execute the query on a single backend instead of the three from the previous profile.
We recently introduced a new option to code generation which tries to balance the benefits of the optimization with the startup overhead of generating the code, this feature can be enabled with the ASYNC_CODEGEN option. This way a query can begin executing immediately while the code generation process is running in parallel and dynamically switch over to the code generated version when it is ready.
| SET NUM_NODES=1;
SET ASYNC_CODEGEN=true; |
Which gives us:
 Query Timeline: 218.338ms
       - Query submitted: 61.530us (61.530us)
       - Planning finished: 10.707ms (10.646ms)
       - Submit for admission: 10.956ms (248.843us)
       - Completed admission: 11.332ms (375.680us)
       - Ready to start on 1 backends: 11.648ms (315.596us)
       - All 1 execution backends (1 fragment instances) started: 13.532ms (1.884ms)
       - Rows available: 208.768ms (195.235ms)
       - First row fetched: 213.969ms (5.201ms)
       - Last row fetched: 213.992ms (22.872us)
       - Released admission control resources: 216.436ms (2.444ms)
       - Unregister query: 218.338ms (1.902ms)
At this point the majority of the time is spent reading and deserializing the parquet data blocks from HDFS. Since Apache Parquet is a columnar format optimized for large groups of rows, it becomes challenging to squeeze any more performance out as we’ll usually have to decode more rows than we directly need for our query. There are recent optimizations to Impala’s use of the Parquet format to speed up row-level lookups, and many more in works such as materialized bloom filters, z-order, and min/max statistics.
Another option is to use a storage manager that is optimized for looking up specific rows or ranges of rows, something that Apache Kudu excels well at. This is especially useful when you have a lot of highly selective queries, which is common in some operational reporting and regulatory compliance scenarios. Here’s the query timeline from the same query running with data in Kudu instead of Parquet.
Query Timeline: 133.531ms
       - Query submitted: 52.392us (52.392us)
       - Planning finished: 28.098ms (28.045ms)
       - Submit for admission: 28.384ms (285.945us)
       - Completed admission: 28.838ms (454.132us)
       - Ready to start on 1 backends: 29.229ms (391.602us)
       - All 1 execution backends (1 fragment instances) started: 31.157ms (1.927ms)
       - Rows available: 115.629ms (84.472ms)
       - First row fetched: 130.542ms (14.912ms)
       - Last row fetched: 130.571ms (28.848us)
       - Released admission control resources: 132.393ms (1.822ms)
       - Unregister query: 133.531ms (1.137ms)
That’s right we were able to reduce our query runtime from 930ms to 218ms and even as low as 133ms with Apache Kudu!
This may have been a lot of configuration parameters we mentioned, but remember you can use Impala’s resource pool feature to create a pool just for small queries and have some of these options automatically applied. Our documentation for resource pools actually provides a perfect example of this case.
Next Steps
So next time you’ve got a data project to tackle whether big or small, remember you can have Apache Impala running on your local computer or a large cluster of servers. Here are some resources to help you get started:
- Our friends at Apache Kudu have a great quickstart guide on how to spin up a local Kudu + Impala environment with docker.
- If you’re looking for a beautiful and sleek interface to your SQL queries you can follow this blog post from the Hue team on how to run a Hue and Impala instance locally.
- Don’t forget even for your data science use cases you can leverage Impala as a fast data cruncher with the awesome pandas dataframe feature of the Impyla library or as part of the Ibis framework.
- And of course, if you’re looking to try Impala in a completely on-demand and elastic environment head over to https://trycdp.com.


