

In the realm of big data analytics, Hive has been a trusted companion for summarizing, querying, and analyzing huge and disparate datasets.
But let’s face it, navigating the world of any SQL engine is a daunting task, and Hive is no exception. As a Hive user, you will find yourself wanting to go beyond surface-level analysis, and deep dive into the intricacies of how a Hive query is executed.
For the Hive service in general, savvy and productive data engineers and data analysts will want to know:
- How do I detect those laggard queries to spot the slowest-performing queries in the system?
- Who are my power users, and which are my famous pools?
- Which users are executing the most queries? Which pools are being used the most?
- I want to check the overall trend for Hive queries, but where can I check it?
- How is my overall query execution trend? How many queries failed?
- How do I define SLAs for workloads?
- Can I set performance expectations with SLAs? How can I track if my queries meet those expectations?
- How can I execute my queries with confidence?
- Is my CDP cluster configured with recommended settings? How do I validate the setting for the platform and services?
When it comes to individual queries, the following questions typically crop up:
- What if my query performance deviates from the expected path?
- When my query goes astray, how do I detect deviations from the expected performance? Are there any baselines for various metrics about my query? Is there a way to compare different executions of the same query?
- Am I overeating?
- How many CPU/memory resources are consumed by my query? And how much was available for consumption when the query ran? Are there any automated health checks to validate the resources consumed by my query?
- How do I detect problems due to skew?
- Are there any automated health checks to detect issues due to skews?
- How do I make sense of the stats?
- How do I use system/service/platform metrics to debug Hive queries and improve their performance?
- I want to perform a detailed comparison of two different runs; where should I start?
- What information should I use? How do I compare the configurations, query plans, metrics, data volumes, and so on?
So many questions and, until recently, no clear path to get answers! But what if we tell you there is a way to find the answers to the above questions easily, allowing you to supercharge your Hive queries, find out where bottlenecks create inefficiencies, and troubleshoot your queries quickly? In a series of blog posts, we will embark on a journey to find out how Cloudera Observability answers all the above questions and revolutionizes your experience with Hive.
So what is Cloudera Observability? Cloudera Observability is an applied solution that provides visibility into the CDP platform and various services running on it and even allows us to take automatic actions where appropriate. Among other capabilities, Cloudera Observability empowers you with comprehensive features to troubleshoot and optimize Hive queries. In addition, it provides insights from deep analytics using query plans, system metrics, configuration, and much more. Cloudera Observability’s array of features allows you to take control of your platform, giving you the ability to make sure your CDP deployments across the hybrid cloud are always operating at their best.
In the first of this blog series, we’ll delve into high-level actionable summaries and insights about the Hive service; we will cover the questions relating to individual queries in a subsequent blog.
Part 1: Your Hive Service at a Glance- Unlocking actionable summaries and Insights
Cloudera Observability presents its insight into the Hive service using a series of widgets to give you a holistic view of the service and uncover actionable insights. As a platform administrator or data engineer, you typically want to start with high-level insights into your Hive queries’ performance. We will illustrate how Cloudera Observability helps find answers to the questions we raised above.
How do I detect those laggard queries to spot the slowest-performing queries in the system?
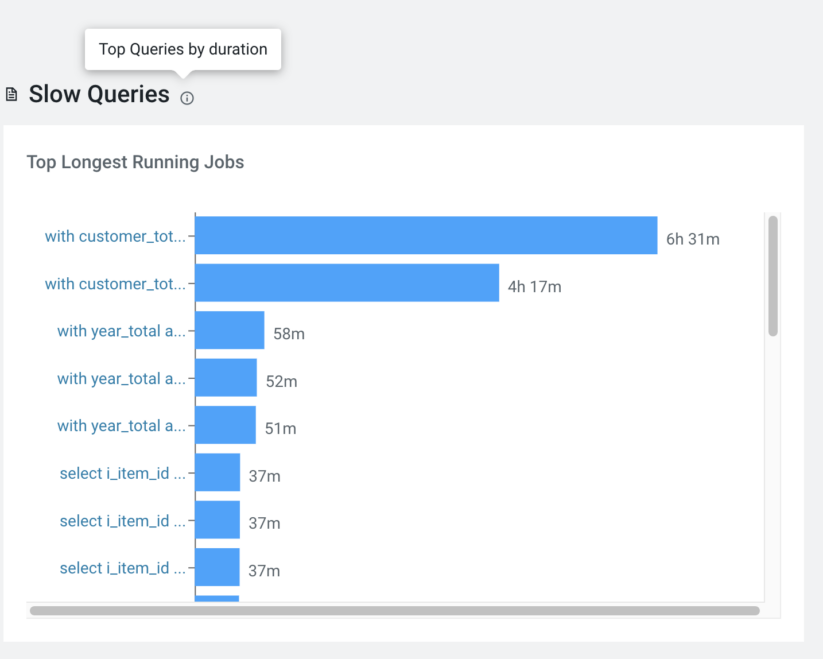
Ever wondered which are the top slowest queries in your Hive service, whether there is any scope to optimize them, or what the resources assigned to those queries are? While the question may sound innocent, answering it requires insight from across the service’s logs, stats, and telemetry. The slow queries widget in Cloudera Observability’s Hive dashboard does this exactly. As a user, you might also want to check the top slowest-running queries during a specific period. After all, your organization will run different workloads during different periods. An ETL job may run overnight, whereas ad-hoc BI exploration typically happens during the day. Selecting a query in the widget will take you to the details of the query execution. Subsequent sections below delve into query execution details.
Here is what the ‘Slow Queries’ widget looks like:
Who are my power users, and which are my famous pools?
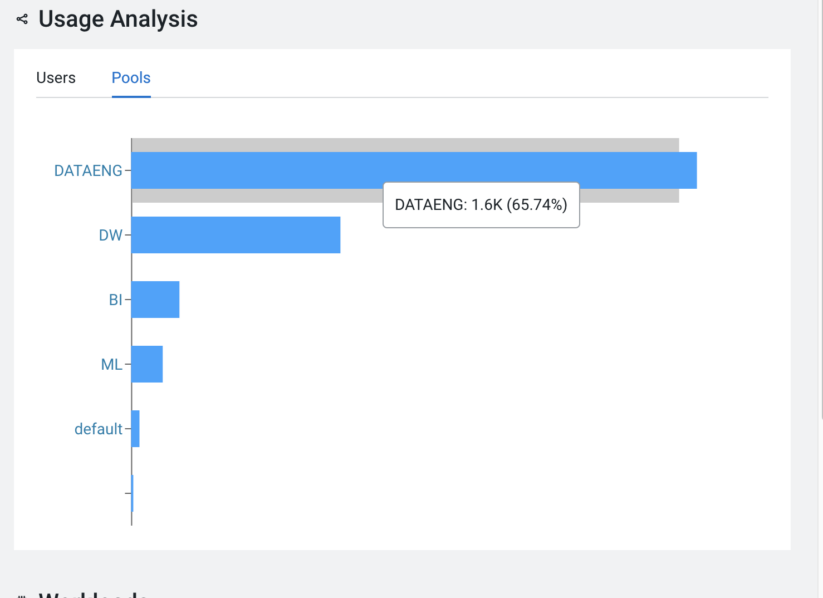
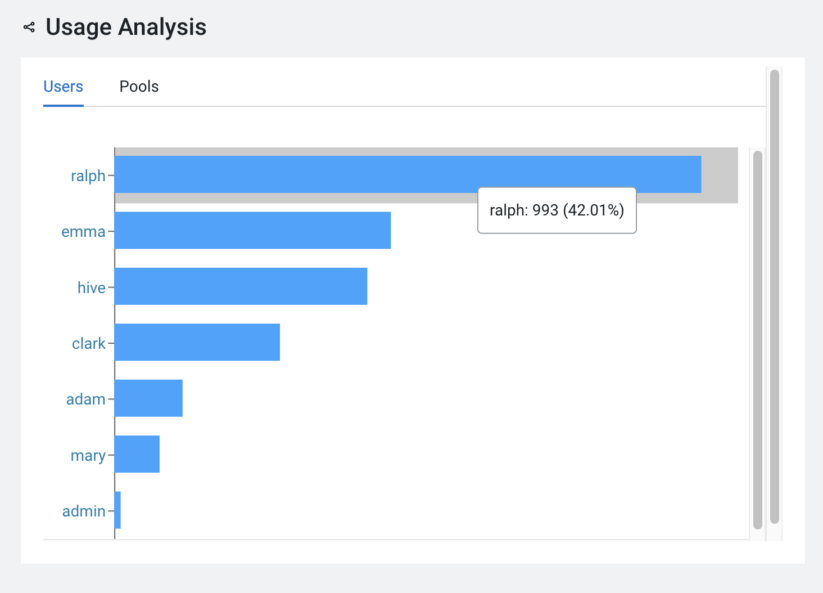
Uncovering the power users and resource-hungry pools is key to ensuring optimal use of the Hive service. Armed with this information, you will be able to assign heavy users to dedicated queues/pools of a resource manager. Doing so will enable you to make informed decisions about whether to increase or decrease the capacity assigned to the heavily used pools. Conversely, you must know if there are any underutilized pools. The ‘Usage Analysis’ widget shows the top users and pools used to run the queries during the specified period. Selecting a user or pool will take you to a list of all queries for that period, allowing you to perform deeper exploration.
I want to check the overall trend for Hive queries, but where can I check it?
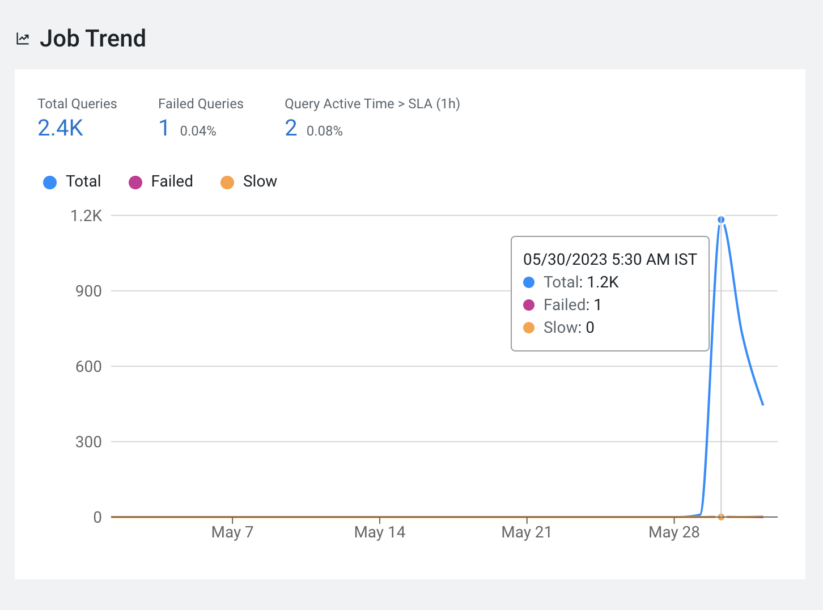
While finding the top queries/users and pools is useful, you must also check the overall query execution trend. For example, you may want to know how many queries failed to execute in a specific period and the reasons for the failures. You will also want to know the execution times for queries and whether they are within the expected range. If the failures or execution times increase, then a closer inspection of other parts of the systems, like data growth or the health of the various components, is required.
Job Trend’ widget with default SLA (1 hour)
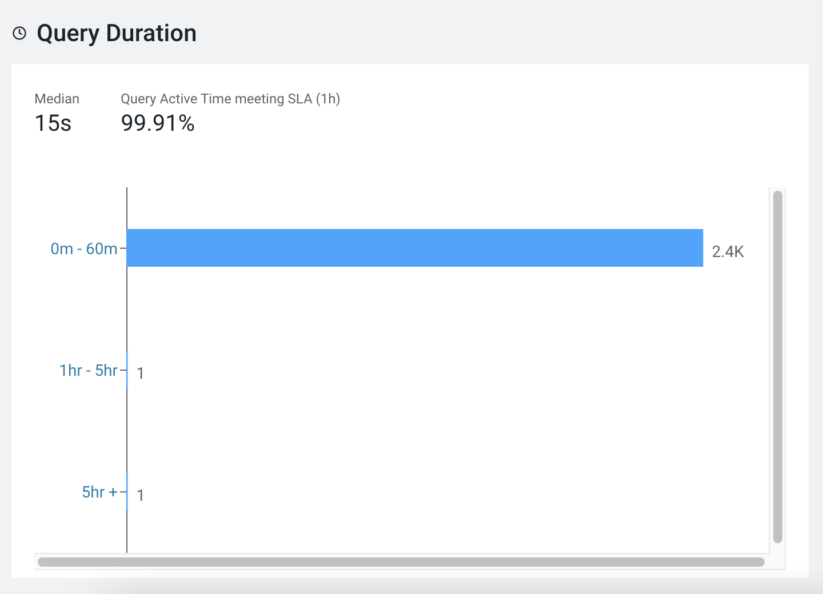
Additionally, the ‘Query Duration’ widget shows the distribution of queries according to the execution times. Clicking on an element in the chart will take you to the list of applicable queries.
How do I define SLAs for workloads?
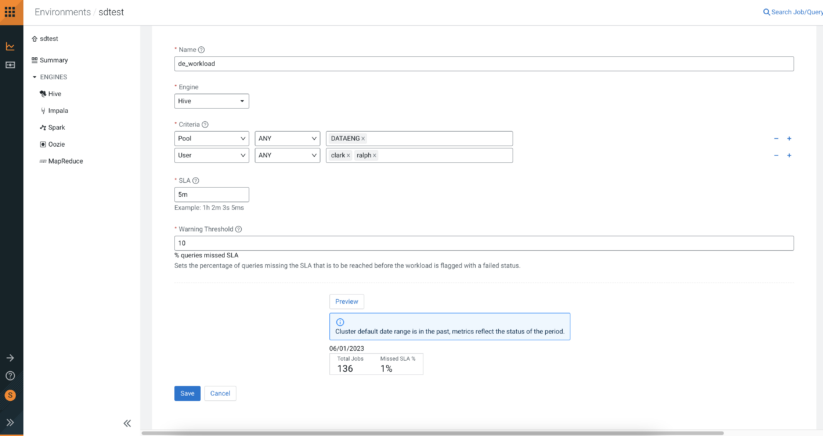
Hive service in your CDP deployment will typically execute diverse workloads. Each workload will have different performance expectations and characteristics. For example, ETL jobs will have a different SLA or SLO than interactive BI analysis. As a user, you will want to set SLAs and check if your queries meet expectations. The ‘Workloads’ feature Cloudera Observability allows you to define workloads based on criteria such as user, pool, start and end time of the query, etc. You can define the SLA for each workload along with a warning threshold. Additionally, you can check all widgets like top slow queries, top users and pools, trends, and distribution by query duration for each defined workload.
Defining a workload
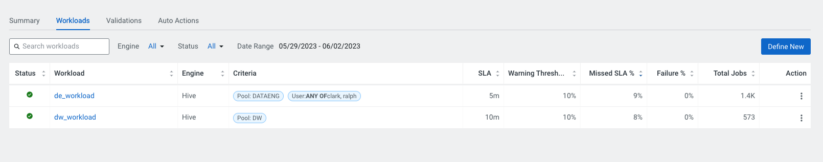
Workloads list
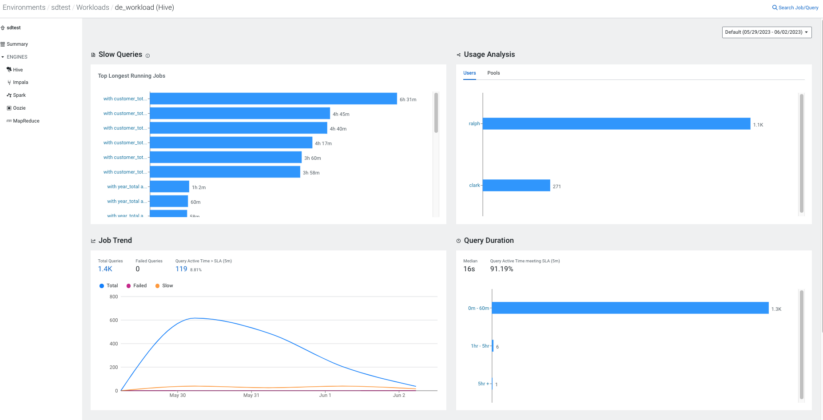
Summary of a workload
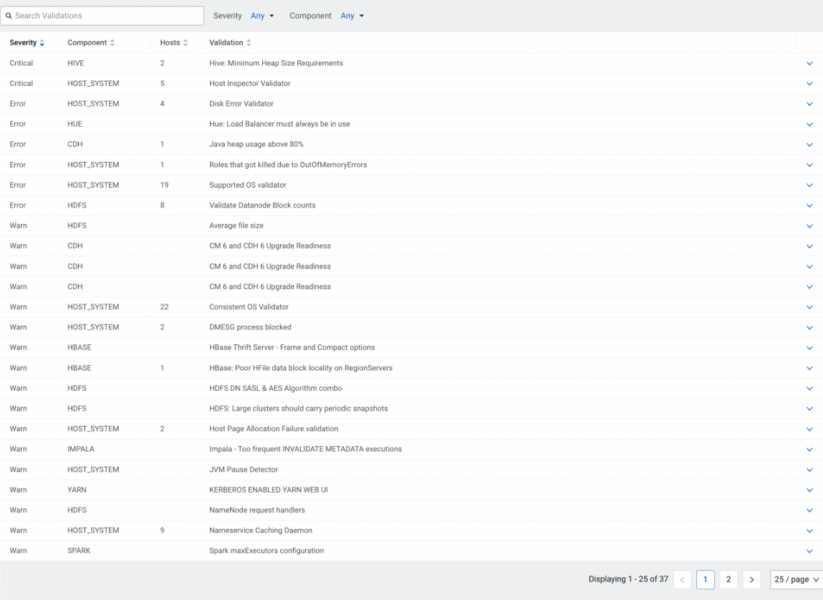
How can I execute my queries with confidence?
While executing your queries, doubts may creep in. You may wonder whether your CDP cluster is setup for success with the current settings. Based on diagnostic data, Cloudera Observability’s validations (based on decades of experience from Cloudera Support) identify known issues and provide recommendations to optimize the cluster. The validations are categorized according to severity levels such as critical, error, warning, information, and curiosity based on the effect they have on cluster stability, operation, and performance.
Cluster validations
As illustrated, gaining insight into your CDP Hive service is a breeze with Cloudera Observability. It provides you the background you need to ensure Hive is happy, healthy and performing as it should so your data analysts can drive insight and value from the data as they query. And that’ll be the second part of this blog: answering your questions as you analyze, optimize and troubleshoot Hive queries.
We’ll be publishing the second part shortly, so stay tuned. If you want to find out more about Cloudera Observability, visit our website and watch the replay of the recent Cloudera Now event, where we presented the solution. If you simply cannot wait any longer and want to get started now, get in touch with your Cloudera account manager or contact us directly.
Editor's Choice

