

As Halloween night quickly approaches, there is only one question on every kid’s mind: how can I maximize my candy haul this year with the best possible candy? This kind of question lends itself perfectly to data science approaches that enable quick and intuitive analysis of data across multiple sources. Using Cloudera Machine Learning, the world’s first hybrid data cloud machine learning tooling, let’s take a deep dive into the world of candy analytics to answer the tough question on everyone’s mind: How do we win Halloween?
So many factors go into obtaining the best possible candy portfolio. First of all it’s all about maximizing the number of doors knocked. This requires a densely populated location. However, this isn’t an option for every trick or treater. For example, I grew up in rural Montana where trick or treating required a car and snowshoes to get to each home (okay, not snowshoes, but definitely snow boots). If you find yourself in this situation, I highly recommend tracking average candy output per home each year. For example, if the Roger’s have handed out king size candy bars every year, it might be worth the extra 10 minute drive.
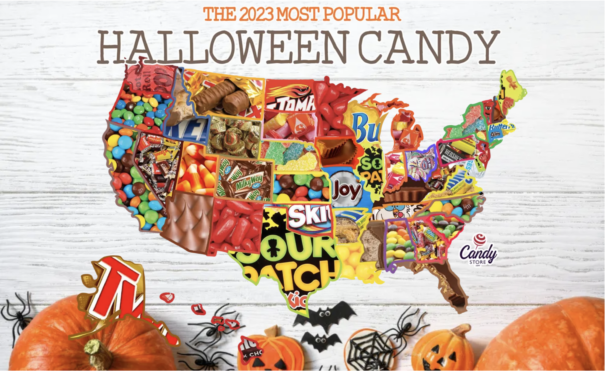
So far we’ve talked about quantity, but just as important is quality. This variable is largely out of your control, and can be dependent on the region you live in. I recently found out that there are companies that actually track the candy sales by state each year. CandyStore.com is one of these companies (on a side note, check out their website if you have a hankering for rare sweets). They released a blog this year with the results from their annual data mining, it includes the top 3 candies purchased for each state and the quantity purchased in pounds.
Some of the top purchased candies are wild. For example, take my home state of Montana, they purchased over 24 thousand pounds of Dubble Bubble Gum. You read that right, Dubble Bubble Gum, the rock-hard, 4-chews-with-flavor gum that everyone yearns for. Other states are a bit more of what you expect, Florida knows that no one can resist a classic like the Reeses Peanut Butter Cup, and Nevada plays it safe with a Hershey’s Mini Bar, a Halloween staple.
This got me thinking though, based on this data, there is likely a difference in taste between those buying the candy and those actually consuming it. Is there an easy way that we could identify these candy market imbalances? Luckily, when CML isn’t solving the world’s most ambitious predictive challenges for enterprise businesses, it’s the perfect tool for this kind of agile and ad-hoc data science discovery. To analyze and satisfy our candy questions, I’ll spin up JupyterLab natively in CML and immediately have access to both scalable compute and secure granular data to tackle this challenge in just a few clicks — let’s get started.
How to avoid the bad candy
If we want to find the states that bought “bad candies”, we need some way to quantify consumer taste preferences for various sweets. Enter The Ultimate Halloween Candy Power Ranking from FiveThirtyEight which contains the survey results from over 269,000 randomly generated candy matchups (i.e. do you like candy A or B better). The end result was a win percentage for 86 different mainstream candies.
Now, if we merge these two data sets together by candy name, we’re able to build a visualization that highlights the top purchased candy in each state, and the preference for that candy. The more black a state is, the more disliked the top candy purchased in that state is. When you hover over a state (or tap if you’re on your phone), the first number is the win percentage for the top candy in that state, you’ll also see the name of the candy and the amount of that candy purchased in 2023, according to CandyStore.com.
There are a few things that stick out to me. Louisianans must have a hankering for candy that kind of tastes like soap, because their top candy purchased is the rarely traded for Lemonhead, coming in at only 39% on FiveThirtyEight’s win percentage. In past candy analyses, Montana had elected Dubble Bubble as their top candy, but they seem to have found the error of their ways and our now focused on more liked candies since the Twix is the new #1 in the Big Sky state. Any state that is buying Candy Corn more than any other candy clearly has something against the children knocking on their doors. Yes, I’m looking at you Utah. Candy Corn’s win percentage is only 38%. So, if you’re a fan of Candy Corn or Lemonheads (aka if you have numb taste buds) you now know where to travel this holiday to find a surplus of your favorite disliked candy.
Analysis like these aren’t earth shattering, but not every analysis needs to be. What every analysis should be though is easy to do. Cloudera provides a variety of tools in the Cloudera Data Platform (CDP) that allow you to easily work with your data. If you want to give a tool like CML a try and run your own candy analysis, head over to our Demo page to learn more about everything that Cloudera has to offer.
Editor's Choice

