

This article is the first of a multipart series to showcase the power and expressibility of FlinkSQL applied to market data. Code and data for this series are available on github. It was co-authored by Krishnen Vytelingum, Head of Quantitative Modeling, Simudyne.
Speed matters in financial markets. Whether the goal is to maximize alpha or minimize exposure, financial technologists invest heavily in having the most up-to-date insights on the state of the market and where it is going. Event-driven and streaming architectures enable complex processing on market events as they happen, making them a natural fit for financial market applications.
Flink SQL is a data processing language that enables rapid prototyping and development of event-driven and streaming applications. Flink SQL combines the performance and scalability of Apache Flink, a popular distributed streaming platform, with the simplicity and accessibility of SQL. With Flink SQL, business analysts, developers, and quants alike can quickly build a streaming pipeline to perform complex data analytics in real time.
In this article, we will be using synthetic market data generated by an agent-based model (ABM) developed by Simudyne. Rather than a top-down approach, ABMs model autonomous actors (or agents) within a complex system — for example, different kinds of buyers and sellers in financial markets. These interactions are captured and the resulting synthetic data sets can be analysed for a number of applications, such as training models to detect emergent fraudulent behavior, or exploring “what-if” scenarios for risk management. ABM generated synthetic data can be useful in situations where historical data is insufficient or unavailable.
Streaming VWAP
We start with a simple example of calculating Volume-Weighted Average Price (VWAP) from a stream of trade events. VWAP is a common benchmark used in trading to gauge the market price and future direction of a security. Here we have a data set in CSV format that shows trade events for a fictional security (SIMUI) in a single trading day (22-Oct-2020).
sym,prc,vol,bid_id,ask_id,buyer_id,seller_id,step,time
SIMUl,149.86,2300,P|63-m-1,P|66-l-0,P|63,P|66,380,22-Oct-2020 08:00:07.600
SIMUl,149.86,1935,P|63-m-1,P|25-l-0,P|63,P|25,380,22-Oct-2020 08:00:07.600
SIMUl,149.74,582,P|18-l-0,P|98-m-0,P|18,P|98,428,22-Oct-2020 08:00:08.560
SIMUl,149.76,2475,P|27-l-0,P|42-m-1,P|27,P|42,1021,22-Oct-2020 08:00:20.420
SIMUl,149.84,21,P|5-m-0,P|42-l-0,P|5,P|42,1078,22-Oct-2020 08:00:21.560
SIMUl,149.76,2709,P|24-l-1,P|92-m-0,P|24,P|92,1200,22-Oct-2020 08:00:24.000
SIMUl,149.84,1653,P|8-m-1,P|24-l-0,P|8,P|24,1513,22-Oct-2020 08:00:30.260
SIMUl,149.84,400,P|19-m-0,P|24-l-0,P|19,P|24,1577,22-Oct-2020 08:00:31.540
The columns are: symbol, price, volume, bid ID, ask ID, buyer ID, seller ID, step, and a timestamp. The step column is an artefact of the discrete step ABM market simulation which can be ignored for our purposes; the rest of the columns are self-explanatory.
To process this data, we need to declare a Flink SQL table by issuing a CREATE TABLE statement. Our sample data is filesystem based, but one can easily change the connector type to read the data from another source, such as a Kafka topic. Note that event_time is a derived column and is also used for the watermark. Watermarking lets Flink limit how much to wait for late arriving and out of order events so it can make progress. Here we declare that records arriving with an event_time more than a minute past the watermark will be ignored.
CREATE TABLE trades (
    symbol         STRING,
    price          DOUBLE,
    vol            INT,
    bid_id         STRING,
    ask_id         STRING,
    buyer_id       STRING,
    seller_id      STRING,
    step           INT,
    ts_str         STRING,
    event_time     AS TO_TIMESTAMP (ts_str, 'dd-MMM-yyyy HH:mm:ss.SSS'),
    WATERMARK FOR event_time AS event_time - INTERVAL '1' MINUTE
) WITH (
    'connector' = 'filesystem',
    'path' = '/path/to/varstream/data/trades_raw',
    'format' = 'csv'
);
The formula for VWAP is simple: for each trade within a specified time period, multiply the price by the number of traded shares. Take the sum of that, and divide it by the total number of traded shares in that time period. The streaming query below will show the current VWAP, which will update as new trade events arrive:
SELECT
  symbol,
  SUM (vol)                     AS cumulative_volume,
  SUM (price * vol)             AS cumulative_pv,
  SUM (price * vol) / SUM (vol) AS vwap
FROM
  trades
GROUP BY
  symbol
;
Real-Time Playback
Since we have only one day’s worth of data from one symbol in a CSV file, the result updates may happen too fast that you barely notice. The events are read from the source faster than they would happen in real-time. It is sometimes desirable (e.g., for demos, or during prototyping and development) to play back historical data in quasi real-time, as if Flink is receiving the historical event data right now.
To help with this, we provide a simple UDTF (user defined table function) that plays back historical data with an artificial delay derived from the row timestamp. The UDTF takes two parameters: the second parameter specifies the row timestamp (in our case, event_time), while the first parameter specifies a duration in minutes after the first row timestamp to start applying the delay. The following snippet shows how to register the UDTF and use it in a view to apply a delay after the first 120 minutes of events have been processed. Note the use of the LATERAL TABLE join, which applies the function to every row in the main table.
-- Register UDTF
CREATE FUNCTION replay_after AS 'varstream.ReplayAfterFunction' LANGUAGE JAVA ;
-- Create a view
CREATE VIEW trades_replay AS (
    SELECT * FROM trades
    LEFT JOIN LATERAL TABLE (replay_after (120, trades.event_time)) ON TRUE
) ;
You can verify how the events are replayed by issuing a simple query:
SELECT * FROM trades_replay
With this view, we can now issue the same VWAP aggregation query and observe streaming updates to the VWAP as if they were happening in real time:
SELECT
  symbol,
  SUM (vol)                     AS cumulative_volume,
  SUM (price * vol)             AS cumulative_pv,
  SUM (price * vol) / SUM (vol) AS vwap
FROM
  trades_replay
GROUP BY
  symbol
;
While this UDTF can be very useful when prototyping, it is not at all intended for production use. We use it here just to demonstrate how FlinkSQL updates aggregate results as events arrive in simulated real-time.
Group Windows
The preceding example shows how you can calculate streaming VWAP for the day. Suppose you want to build a trading dashboard with candle charts at 1 minute intervals. You would want to calculate the VWAP, high price, low price, and total volume for each minute. Flink SQL makes this easy with group windows, which can apply aggregation functions on a GROUP BY time interval.
The following shows how you can derive VWAP for each minute:
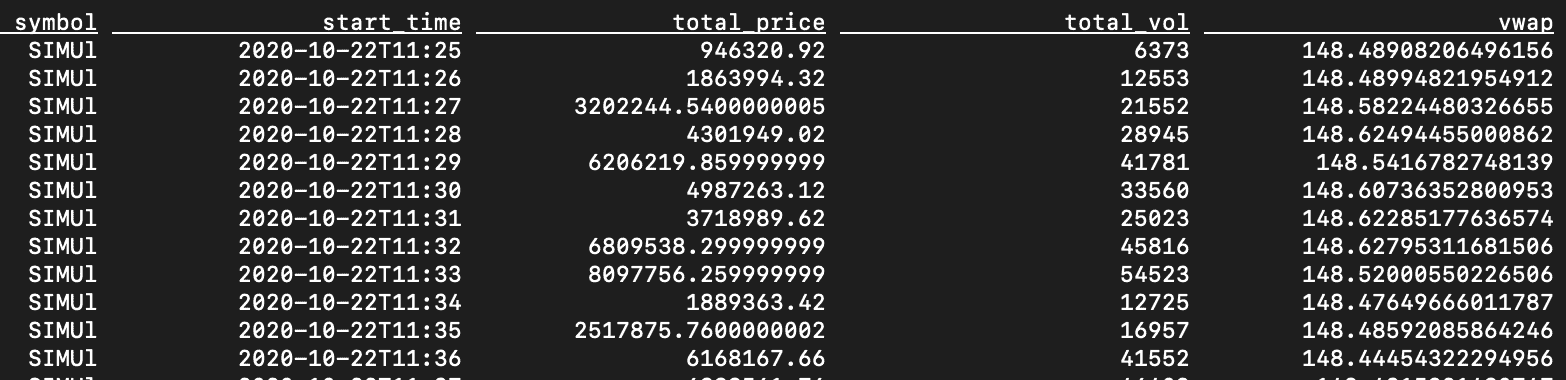
CREATE VIEW vwap_1m AS (
    SELECT
        symbol,
        TUMBLE_START (event_time, INTERVAL '1' MINUTES) AS start_time,
        TUMBLE_ROWTIME (event_time, INTERVAL '1' MINUTES) AS row_time,
        MAX (price)          AS max_price,
        MIN (price)          AS min_price,
        SUM (price * vol)    AS total_price,
        SUM (vol)            AS total_vol,
        SUM (price * vol) / SUM (vol) AS vwap
    FROM
        trades
    GROUP BY
        TUMBLE (event_time, INTERVAL '1' MINUTES), symbol
);
SELECT symbol, start_time, total_price, total_vol, vwap FROM vwap_1m ;
The preceding calculates a VWAP for the trades that occurred within each minute. If you want to calculate a moving VWAP (MVWAP) over a span of minutes, Flink SQL provides a hopping group window. The following shows a 5-minute moving VWAP with a step of 1-minute.
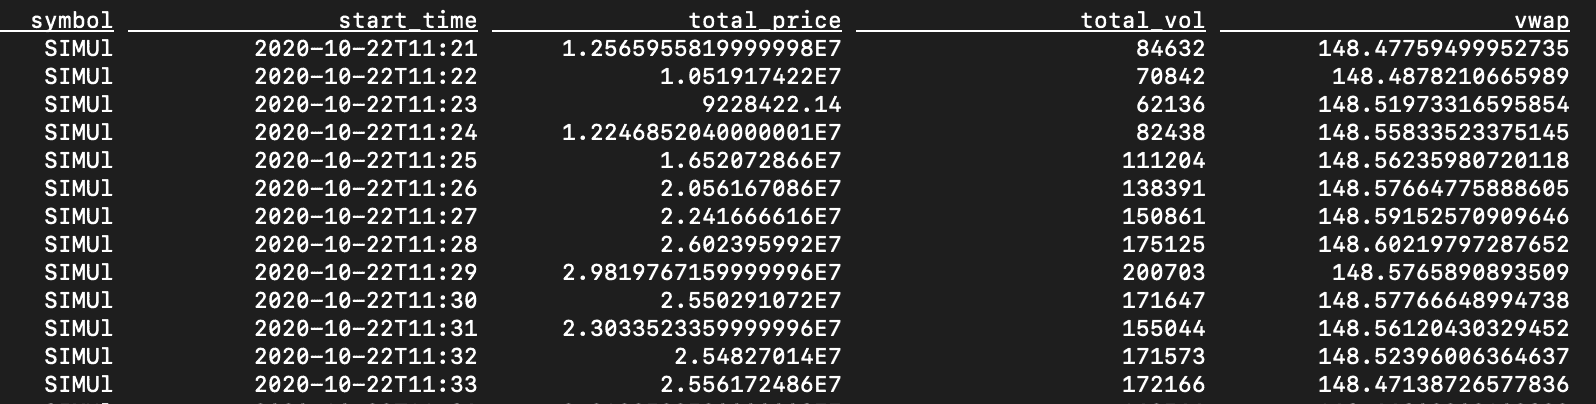
CREATE VIEW vwap_5m AS (
    SELECT
        symbol,
        HOP_START (event_time, INTERVAL '1' MINUTES, INTERVAL '5' MINUTES) AS start_time,
        HOP_ROWTIME (event_time, INTERVAL '1' MINUTES, INTERVAL '5' MINUTES) AS row_time,
        MAX (price)          AS max_price,
        MIN (price)          AS min_price,
        SUM (price * vol)    AS total_price,
        SUM (vol)            AS total_vol,
        SUM (price * vol) / SUM (vol) AS vwap
    FROM
        trades
    GROUP BY
        HOP (event_time, INTERVAL '1' MINUTES, INTERVAL '5' MINUTES), symbol
);
SELECT symbol, start_time, total_price, total_vol, vwap FROM vwap_5m ;
Conclusion
Flink SQL can greatly simplify and expedite the development of streaming dataflows. In this article, we explored different uses of the SQL GROUP BY clause to calculate variations of VWAP from a stream of market data. In the next installment, we will show you how to extract a streaming minute-by-minute sample from market data to calculate Intraday Value-at-Risk (IVaR). We hope this series will encourage you to try Flink SQL for streaming market data applications.
Thanks to Tim Spann, Felicity Liu, Jiyan Babaie-Harmon, Roger Teoh, Justin Lyon, and Richard Harmon for their contributions to this effort.
Editor's Choice

