

How Bad is Bad Code: The ROI of Fixing Broken Spark Code
Once in a while I stumble upon Spark code that looks like it has been written by a Java developer and it never fails to make me wince because it is a missed opportunity to write elegant and efficient code: it is verbose, difficult to read, and full of distributed processing anti-patterns.
One such occurrence happened a few weeks ago when one of my colleagues was trying to make some churn analysis code downloaded from GitHub work.
I was looking for some broken code to add a workshop to our Spark Performance Tuning class and write a blog post about, and this fitted the bill perfectly.
For convenience purposes I chose to limit the scope of this exercise to a specific function that prepares the data prior to the churn analysis.
Here it is in all its glorious juiciness:

from pyspark.sql.functions import udf,col

from pyspark.sql.types import IntegerType


def prepare_data_baseline(df):


    '''

    Function to prepare the given dataframe and divid into groups of churn and non churn

    users while returnng the original datafrme with a new label column into a spark dataframe.

    Args:

        df- the original dataframe

    Returns:

        df -  dataframe of the dataset with new column of churn added

        stayed -  dataframe of the non -churn user's activities only.

        all_cancelled -  dataframe of the churn user's activities only.

    '''


    #Define a udf for cancelled

    canceled = udf(lambda x: 1 if x == 'Cancellation Confirmation' else 0)


    #define a new column 'churn' where 1 indicates cancellation of subscription, 0 otherwise

    df = df.withColumn('Churn', canceled(df.page))


    #Dataframe of all that cancelled

    cancelled_df = df.select('page', 'userId','Churn').where(col('churn')==1)

    #List of cancelled

    list_cancelled = cancelled_df.select('userId').distinct().collect()#list of cancelled users


    #Put in a list format

    gb = []#temporary variable to store lists

    for row in list_cancelled:

        gb.append(row[0])

    canc_list = [x for x in gb if x != '']#remove the invalid users

    #Total number of users who canceled

    print(f"The number of churned users is: {len(canc_list)}")


    #List of staying users

    all_users = df.select('userId').distinct().collect()

    gh = []#a temporary variable to store all users


    for row in all_users:

        gh.append(row[0])

    stayed_list = set(gh)-set(gb)#list of users staying

    stayed_list = [x for x in stayed_list if x != '']#remove the invalid users


    #Total number of users who did not cancel

    print(f"The number of staying users is: {len(stayed_list)}")


    #Store both canceled and staying users in new dataframes containng all actions they undertook

    all_cancelled = df.select("*").where(col('userId').isin(canc_list))

    stayed = df.select('*').where(col('userId').isin(stayed_list))


    #Redefine a udf for churn

    churned = udf(lambda x: 0 if x in stayed_list else 1, IntegerType())

    #Creat new column which will be our label column to track all users that eventually cancelled their subscription

    df = df.withColumn('label', churned(col('userId')))


    return df, stayed, all_cancelled
In this blog post, I will outline the steps I took to fix this code, and then measure the resulting difference in execution performance. In the process, I will explicitly state the best practices I will implement.
Let’s jump in this rabbit hole!
Define a non-regression test harness
Stop!
Resist the temptation to start tweaking the code right away!
You want to be able to:
- Make sure that you do not introduce a regression by fixing the code
- Measure the improvements in terms of performance
This is where limiting the scope of the analysis to a function came in handy: it allowed me to use ad hoc and simple tooling:
- I isolated the original function in a prepare_data_baseline function in a separate prepareData_baseline.py file
- I created a new file called prepare_data.py with the new version of the prepare_data function
- I measured the time to perform the processing using the time library
- And I compared the resulting DataFrames with subtract
Because lazy evaluation defers the time when the code is actually executed, I added code that saves the DataFrames to files, thus forcing the materialization of the DataFrames via the execution of the code. I also added these lines in the scope of the time measurement.
And this is what it looks like:
from pyspark.sql import SparkSession

import time, datetime

from prepareData import prepare_data

from prepareData_baseline import prepare_data_baseline


spark = SparkSession \

    .builder \

    .appName("Churn Analysis Data Preparation Test Harness") \

    .getOrCreate()

spark.sparkContext.setLogLevel("ERROR")


spark.conf.set('spark.sql.adaptive.enabled','false')

print(f"AQE enabled: {spark.conf.get('spark.sql.adaptive.enabled')}")


df = spark.read.json('data/mini_sparkify_event_data.json')


#Baseline version


process_time_start = time.perf_counter()                   # Start timer: begin processing

df_baseline, stayed_baseline, all_cancelled_baseline = prepare_data_baseline(df)

df_baseline.write.mode("overwrite").json('data/df_baseline')

stayed_baseline.write.mode("overwrite").json('data/stayed_baseline')

all_cancelled_baseline.write.mode("overwrite").json('data/all_cancelled_baseline')

process_time_end = time.perf_counter()                     # Stop timer: end processing

process_time = process_time_end - process_time_start       # Elapsed time for processing

totalTime = datetime.timedelta(seconds = process_time)


print(f"Preparing data took with the baseline version took {totalTime}")


#New version


process_time_start = time.perf_counter()                   # Start timer: begin processing

df, stayed, all_cancelled = prepare_data(df)

df.write.mode("overwrite").json('data/df')

stayed.write.mode("overwrite").json('data/stayed')

all_cancelled.write.mode("overwrite").json('data/all_cancelled')

process_time_end = time.perf_counter()                     # Stop timer: end processing

process_time = process_time_end - process_time_start       # Elapsed time for processing

totalTime = datetime.timedelta(seconds = process_time)


print(f"Preparing data took with the new version took {totalTime}")


# Regression Testing


def diffDataFrame(df1,df2):

    return df1.subtract(df2).count()


print(f"New processing introduced {diffDataFrame(df,df_baseline)} differences in df.")

print(f"New processing introduced {diffDataFrame(all_cancelled,all_cancelled_baseline)} differences in all_cancelled.")

print(f"New processing introduced {diffDataFrame(stayed,stayed_baseline)} differences in stayed.")


spark.stop()
Retro document the requirements
This step was quite easy because of the comments that were present in the initial code.
This function:
- Takes a DataFrame containing activities from users,
- splits it into two groups of activities:
- activities from users who eventually churned and
- activities from users who did not, and
- adds a “label” column to the input DataFrame to tag activities that belong to users that eventually churned (1 if user churned 0 otherwise).
If that sounds suspiciously redundant to you I agree. But let’s table that issue for now; we will revisit it once we are satisfied with our new version of the code.
Refactor the code
The main problem of the code is the use of Python lists to achieve the required results. Those lists are created by collecting the DataFrames onto the Spark driver where the for loops will be processed, making this code not scalable: above a certain number of users the driver memory might become overwhelmed and the program will crash.
Also this choice prevents the code from leveraging all the optimizations that come with DataFrames operations.
Then the code uses plain Pyspark UDFs for which you incur a performance penalty because of the need to:
- Deserialize the Spark DataFrame to its Java representation
- Transfer the resulting Java object to the Python process where the UDF will be executed
- Serialize back the output of the function to Spark format
Beware of the cost of Pyspark UDFs
There are ways to mitigate those issues by using PyArrow and vector UDFs when you really need to use them, but this is not one of those times.
First, the function creates a “Churn” column, which I guess is for convenience purposes. A user is identified as “churned” if they have been to the “Cancellation Confirmation” page.
This is achieved with a withColumn call and a UDF.
#Define a udf for cancelled canceled = udf(lambda x: 1 if x == 'Cancellation Confirmation' else 0) #define a new column 'churn' where 1 indicates cancellation of subscription, 0 otherwise df = df.withColumn('Churn', canceled(df.page))
There is no need for a UDF in that case, those lines of code can be replaced by a simple column expression like so:
#define a new column 'churn' where 1 indicates cancellation of subscription, 0 otherwise

    df = df.withColumn('Churn', (df.page == 'Cancellation Confirmation').cast('integer').cast('string'))
I believe the correct type for that new column would be boolean, but for non-regression purposes I had to cast it to a string of 0 or 1.
Then the author proceeds to create two lists: one for the users that churned and one for the users that stayed. Since my goal is to avoid those lists, I am going to create the corresponding DataFrames instead:
 all_users = df.select(df.userId).distinct().where(df.userId != '')

    churned_users = df.where(df.Churn == '1').select(df.userId).distinct().where(df.userId != '')

    stayed_users = all_users.subtract(churned_users)
First I create a DataFrame of all the non-empty users, then the DataFrame of users that churned, and define the users that stayed as the difference between the two.
The author uses the awkwardly created lists together with UDFs to create the all_cancelled and stayed DataFrames. Here is the code for the first one:
#List of cancelled

    list_cancelled = cancelled_df.select('userId').distinct().collect()#list of cancelled users


    #Put in a list format

    gb = []#temporary variable to store lists

    for row in list_cancelled:

        gb.append(row[0])

    canc_list = [x for x in gb if x != '']#remove the invalid users

…

    all_cancelled = df.select("*").where(col('userId').isin(canc_list))
I realize now that the “Put in list format” loop is probably unnecessary.

To create the same DataFrame I just do the following:
all_cancelled = df.join(churned_users,'userId')
The same technique is applied to create the stayed DataFrame:
stayed = df.join(stayed_users,'userId')
Last the author adds the “label” column to the main DataFrame by using a UDF:
#Redefine a udf for churn

    churned = udf(lambda x: 0 if x in stayed_list else 1, IntegerType())

    #Creat new column which will be our label column to track all users that eventually cancelled their subscription

    df = df.withColumn('label', churned(col('userId')))
Instead I just use a union:
df_label = all_cancelled.withColumn('label',lit(1)).union(stayed.withColumn('label',lit(0)))
That triggered a regression because I did not include the null users. I wonder what use could be made of records with null users for training a model to predict churn from users’ behavior, but for non-regression purposes I added those too:
    empty_users = df.where(df.userId.isNull())

…

    #Add empty users for non regression purposes


    df_label = df_label.union(empty_users.withColumn('label',lit(1)))
Last, I also had to reorder the columns of my DataFrames for my simple non-regression tests to be successful:
# Sort the columns
    columns = ['artist','auth','firstName','gender','itemInSession','lastName','length','level','location','method','page','registration','sessionId','song','status','ts','userAgent','userId','Churn','label']

    df_label_sorted = df_label.select(columns)

    columns = ['artist','auth','firstName','gender','itemInSession','lastName','length','level','location','method','page','registration','sessionId','song','status','ts','userAgent','userId','Churn']

    all_cancelled_sorted = all_cancelled.select(columns)

    stayed_sorted = stayed.select(columns)
This is my full version of the function:
from pyspark.sql.functions import lit


def prepare_data(df):


    '''

    Function to prepare the given dataframe and divide into groups of churn and non churn

    users while returning the original DataFrame with a new label column into a spark dataframe.

    Args:

        df- the original dataframe

    Returns:

        df -  dataframe of the dataset with new column of churn added

        stayed -  dataframe of the non -churn user's activities only.

        all_cancelled -  dataframe of the churn user's activities only.

    '''


    #define a new column 'churn' where 1 indicates cancellation of subscription, 0 otherwise

    df = df.withColumn('Churn', (df.page == 'Cancellation Confirmation').cast('integer').cast('string'))


    all_users = df.select(df.userId).distinct().where(df.userId != '')

    churned_users = df.where(df.Churn == '1').select(df.userId).distinct().where(df.userId != '')

    stayed_users = all_users.subtract(churned_users)

    empty_users = df.where(df.userId.isNull())


    #Store both canceled and staying users in new DataFrames containing all actions they undertook


    all_cancelled = df.join(churned_users,'userId')

    stayed = df.join(stayed_users,'userId')

    df_label = all_cancelled.withColumn('label',lit(1)).union(stayed.withColumn('label',lit(0)))


    #Add empty users for non regression purposes


    df_label = df_label.union(empty_users.withColumn('label',lit(1)))


    # Sort the columns

    columns = ['artist','auth','firstName','gender','itemInSession','lastName','length','level','location','method','page','registration','sessionId','song','status','ts','userAgent','userId','Churn','label']

    df_label_sorted = df_label.select(columns)

    columns = ['artist','auth','firstName','gender','itemInSession','lastName','length','level','location','method','page','registration','sessionId','song','status','ts','userAgent','userId','Churn']

    all_cancelled_sorted = all_cancelled.select(columns)

    stayed_sorted = stayed.select(columns)


    #Total number of users who canceled

    print(f"The number of churned users is: {churned_users.count()}")

    #Total number of users who did not cancel

    print(f"The number of staying users is: {stayed_users.count()}")


    return df_label_sorted, stayed_sorted, all_cancelled_sorted
Non regression and performance
I was able to verify that I had not introduced any regression in my version of the function on my desktop with Spark 3.3.
In order to get meaningful performance measurements I needed to use the full 12G JSON dataset. Otherwise, with small data, most of the time is spent on overhead and results vary wildly.
So I switched to our CML data service using Spark 3.2 and adapted the code accordingly.
CML uses Spark on Kubernetes and the default is dynamic allocation of executors. I had to disable that to get a stable environment and thus, meaningful measures:
import time, datetime

from prepareData import prepare_data

from prepareData_baseline import prepare_data_baseline

from prepareData_improved import prepare_data_improved

import cml.data_v1 as cmldata

from env import S3_ROOT, S3_HOME, CONNECTION_NAME


conn = cmldata.get_connection(CONNECTION_NAME)

spark = (

            SparkSession.builder.appName(conn.app_name)

            .config("spark.sql.hive.hwc.execution.mode", "spark")

            .config("spark.dynamicAllocation.enabled","false")

            .config("spark.executor.instances", 3)

            .config("spark.executor.memory","32g")

            .config("spark.executor.cores",4)

            .config("spark.yarn.access.hadoopFileSystems", conn.hive_external_dir)

            .getOrCreate()

        )


spark.sparkContext.setLogLevel("ERROR")

spark.conf.set('spark.sql.adaptive.enabled','true')

print(f"AQE enabled: {spark.conf.get('spark.sql.adaptive.enabled')}")
That got me the desired result:
I then found out that the full 12G data set contained a corrupt record that I had to deal with, and while I was at it I converted the file to Parquet format to save me some time:
Convert early to compressed columnar formats (Parquet, ORC)
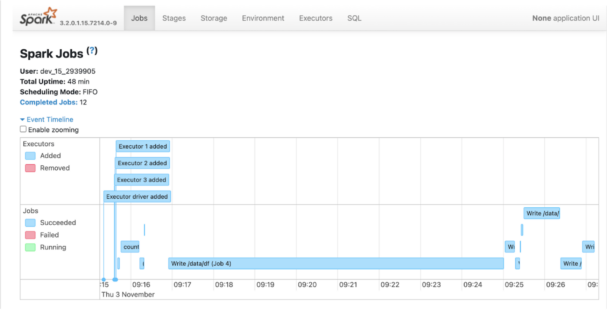
I created a function that performs the tests to avoid repetitive code in which I also added calls to setJobGroup and setJobDescription to improve the readability of the Spark UI:
def measureDataPreparation(df,f,versionName):

  spark.sparkContext.setJobGroup(versionName,"")

  # Start timer: begin processing

  process_time_start = time.perf_counter()

  df, stayed, all_cancelled = f(df)

  spark.sparkContext.setJobDescription("Write /data/df")

  df.write.mode("overwrite").json(S3_HOME + '/data/df')

  spark.sparkContext.setJobDescription("Write /data/stayed")

  stayed.write.mode("overwrite").json(S3_HOME + '/data/stayed')

  spark.sparkContext.setJobDescription("Write /data/all_cancelled")

  all_cancelled.write.mode("overwrite").json(S3_HOME + '/data/all_cancelled')

  # Stop timer: end processing

  process_time_end = time.perf_counter()

  # Elapsed time for processing

  process_time = process_time_end - process_time_start

  totalTime = datetime.timedelta(seconds = process_time)

  print(f"Preparing data with the {versionName} took {totalTime}")
Use setJobGroup and setJobDescription to improve readability of the Spark UI
And this is how the Spark UI looks as a result:
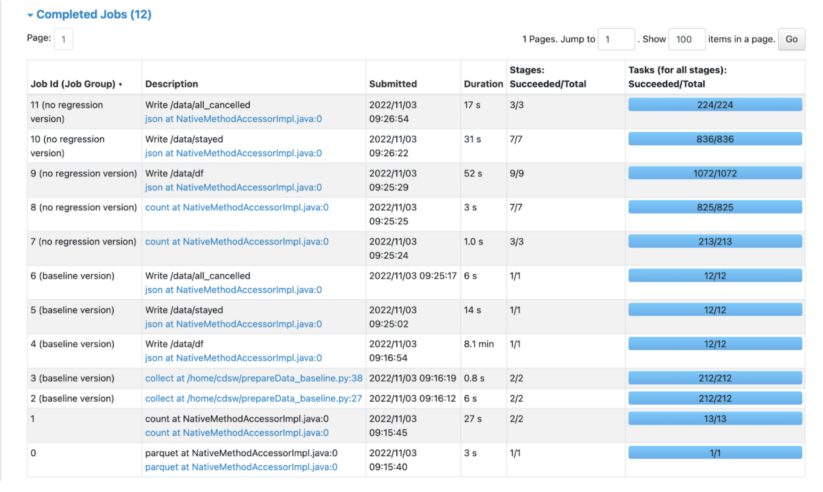
Since I had established that I had not introduced any regression, I also removed the regression tests.
Here is the the relevant part of the session’s output:
measureDataPreparation(df,prepare_data_baseline,"baseline version")

The number of churned users is: 4982

The number of staying users is: 17282

Preparing data with the baseline version took 0:09:11.799036


measureDataPreparation(df,prepare_data,"no regression version")

The number of churned users is: 4982

The number of staying users is: 17282

Preparing data with the no regression version took 0:01:48.224514
Great success! The new version is more than four times more efficient!
Further improvements
Since I no longer need to test for non regression I can remove the sorting of the columns.
I can also remove the code that prints the counts of the churned and stayed users. This code does not belong in a function that very likely will run unattended in a data pipeline.
It triggers distributed execution to compute results that nobody will see. It should be left to the code that calls the function to log that kind of information or not.
This is also an instance of breaking the following rule:
Remove code that helped debugging with count(), take() or show() in production
I checked the rest of the initial code, and after exhaustive data exploration and right before splitting the data set for training purposes, the author does remove the rows with null users. There is no point in carrying around this extra baggage all this time. In fact this breaks another rule of big data processing:
Filter early
Finally, I removed the casting of the “Churn” column and left it as a boolean. I also checked that it was not used outside of this function and renamed it “churn” because I hated that uppercase “C” with all the passion of a thousand white hot blazing suns.
This is the final version of the code:
from pyspark.sql.functions import lit


def prepare_data_improved(df):


    '''

    Function to prepare the given DataFrame and divide into groups of churn and non churn

    users while returning the original DataFrame with a new label column into a Spark DataFrame.

    Args:

        df- the original DataFrame

    Returns:

        df -  DataFrame of the dataset with new column of churn added

        stayed -  DataFrame of the non -churn user's activities only.

        all_cancelled -  DataFrame of the churn user's activities only.

    '''


    #define a new column 'churn' where 1 indicates cancellation of subscription, 0 otherwise

    df = df.where(df.userId != '').withColumn('churn', (df.page == 'Cancellation Confirmation'))


    all_users = df.select(df.userId).distinct()

    churned_users = df.where(df.churn).select(df.userId).distinct()

    stayed_users = all_users.subtract(churned_users)


    #Store both canceled and staying users in new DataFrames containing all actions they undertook


    all_cancelled = df.join(churned_users,'userId')

    stayed = df.join(stayed_users,'userId')

    df_label = all_cancelled.withColumn('label',lit(1)).union(stayed.withColumn('label',lit(0)))


    return df_label, stayed, all_cancelled
Conclusion
Now that I have achieved non regression using DataFrame exclusively, and that I also have an improved version, I should be able to measure the benefits of using the Spark cache and of the Adaptive Query Execution engine.
Here are the full results:
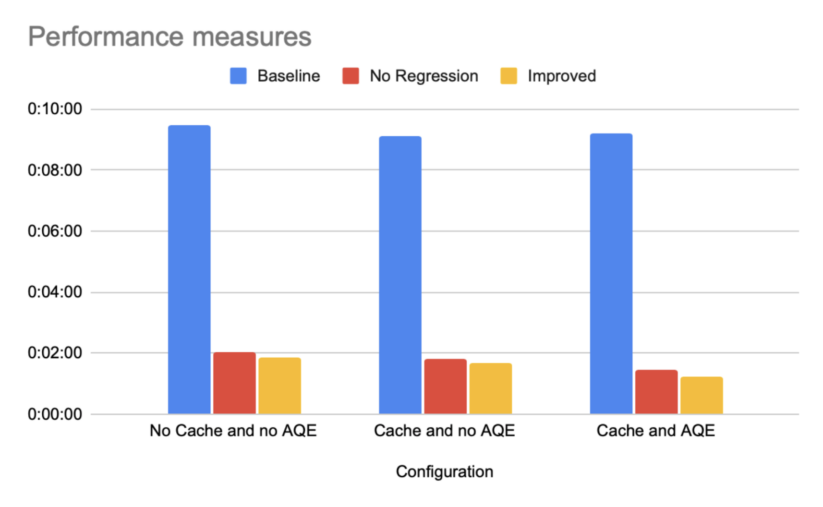
In this limited experiment, the number one factor that influences the performance of the execution is the refactoring of the Spark code to remove the distributed processing anti-patterns.
Caching the data, improving the code further, or using AQE all bring marginal improvements compared to the elimination of the technical debt.
The return on investment of training is always a thorny issue because of the difficulty to conveniently measure it in a spreadsheet but, with this experiment, I hope I have shown that the lack of skills should be a major concern for any organization running Spark workloads.
If you’d like to get hands-on experience with Spark 3.2, as well as other tools and techniques for making your Spark jobs run at peak performance, sign up for Cloudera’s Apache Spark Performance Tuning course.
If you need an introduction to AQE kindly refer to my previous blog post.
Editor's Choice

