Introduction
We are continuing our blog series about implementing real-time log aggregation with the help of Flink. In the first part of the series we reviewed why it is important to gather and analyze logs from long-running distributed jobs in real-time. We also looked at a fairly simple solution for storing logs in Kafka using configurable appenders only. As a reminder let’s review our pipeline again
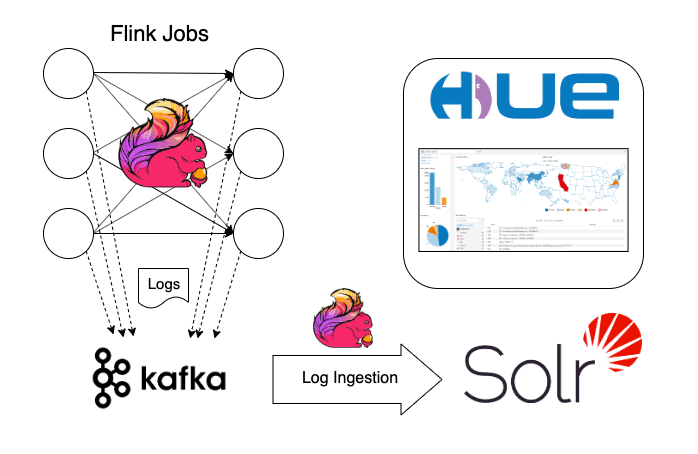
In this chapter, we will look at the topics of ingestion, searching, and visualization. We will still rely on standard open source components that are available at our disposal in the CDP stack to finish our pipeline. The approach of using open source components in our solution ensures that the pipeline itself can be split along standard layers and can be easily integrated with any centralized log management systems. We will have a look at a few popular solutions later in the article but now let’s see how we can search and analyze the logs already stored in Kafka without leaving our cozy CDP environment.
Indexing the logs into Solr using Flink
We build our log ingestion/indexing pipeline using Flink and Solr. Flink provides all the necessary abstractions to implement a robust log indexer and additional capabilities for post-processing such as complex alerting logic. Using the checkpointing mechanism, we can guarantee that all logs are ingested even in the time of failures.
The full log ingestion implementation together with build instructions can be found on GitHub. Before we build and run it, however, let us take a closer look at the streaming job itself.
Ingestion job overview
The LogIndexerJob is our Flink streaming job entry point.
Our ingestion pipeline is fairly straight-forward:
- Kafka Source for incoming JSON logs
- Processing window and indexer to ingest the logs to Solr
- Arbitrary custom logic for log monitoring and alerting
Let’s look at each of these steps in detail.
Kafka JSON input
The first step of our pipeline is to access the JSON logs from Kafka. We achieve this by first reading the raw String messages using the FlinkKafkaConsumer source, then converting them to a stream of Map<String, String>s for more convenient access.
FlinkKafkaConsumer<String> logSource = new FlinkKafkaConsumer<>(

                inputTopic, new SimpleStringSchema(), kafkaProps);


KeyedStream<Map<String, String>, String> logStream = env

    .addSource(logSource)

        .name("Kafka Log Source")

        .uid("Kafka Log Source")

    .flatMap(new LogParser())

        .name("JSON parser")

        .keyBy(map -> map.get(LogParser.YARN_CONTAINER_ID_KEY));
We read the stream of logs from Kafka as JSON String data and use the Jackson library to convert the JSON to a Map inside the LogParser class. At the same time, we clean up some unnecessary fields from our JSON and add an additional yarnApplicationId field derived from the container id.
The application id serves as a top-level grouping identifier for all logs of a single Flink job, while container ids can be used to distinguish log messages coming from the different task managers.
As the LogParser class uses Map<String, String> as the output type we provide extra type of information throughout the ResultTypeQueryable interface. By declaring our TypeInformation to be new MapTypeInfo<>(String.class, String.class), we make sure that our data is serialized as efficiently as possible.
Notice that a keyBy operation is applied to the stream of maps. The reason for this is that parallel window operations are executed only on keyed streams. We decided to choose the container id as a key, but we could have also just used any reasonable key to provide the required parallelism for the indexing step.
Windowed log indexing logic
Now that we have a stream of maps with exactly the data we aim to store, our next step is to add them to Solr.
While Solr can handle vast amounts of data to be indexed (called documents in Solr terminology), we want to make sure that the communication between Flink and Solr doesn’t choke our data pipeline. The most straightforward approach to this is to batch indexing requests together.
We leverage Flink’s processing time window mechanism to create these batches, and by choosing the window size sufficiently small (a few seconds) the end-to-end latency is kept to a reasonable minimum.
DataStream<UpdateResponse> logIndexResponse = logStream

        .timeWindow(Time.seconds(params.getLong(LOG_INDEXING_BATCH_SIZE, 10)))

        .apply(new SolrIndexer(params))

        .name("Solr Indexer")

        .uid("Solr Indexer");
The actual indexing logic happens inside the SolrIndexer window function and it consists of the following 3 steps:
- Creating the Solr Client when the operator starts
- When we receive the windows of messages, we index them using the client
- Shut down the Solr Client when the operator stops
Steps 1. and 3. are executed only once per job, so they are implemented in the operator’s respective lifecycle method, open and close. The indexing step 2. will be executed for each incoming window, so it is implemented in the apply method of the window function.
Configuration parameters are passed in the constructor of the function and they are serialized together with the function definition. Our indexer operator takes the following required configuration parameters which should be specified in our job properties file:
solr.urls=<solr-host:port>/solr

solr.collection=flink-logs
The output of the indexing logic is a stream of UpdateResponse objects which contain information whether or not the indexing request was successfully received by Solr.
Indexing Error handling
In this reference implementation, we opted for a simplistic approach to error handling where we just log indexing errors without taking action on them.
An alternative approach for critical logs would be to ensure that the indexing steps are retried until they succeed, the retry logic could be easily incorporated into the window function implementation.
Custom log processing logic
Once we have our log stream continuously ingested in our Flink job, we have great flexibility to leverage it for many things beyond simply indexing them to Solr.
With some domain-specific understanding we can easily add some logic to detect patterns in our logs that would be otherwise hard to implement on the dashboarding layer.
We can also use Flink’s stateful processing abstractions to build up a health profile of our applications over time and quickly detect problems as they develop over time.
Running the Flink application
Before we can start our Flink application, we must create the Solr collection that will be populated with the logs. We can simply do this in 2 steps using the command-line client:
solrctl config --create flink-logs-conf schemalessTemplate -p immutable=false

solrctl collection --create flink-logs -c flink-logs-conf
Once the collection is ready, we can create solr_indexer.props file to specify our application parameters:
# General props

log.input.topic=flink.logs

# Solr props

solr.urls=<solr-host:port>/solr

solr.collection=flink-logs

# Kafka props

kafka.group.id=flink

kafka.bootstrap.servers=<kafka-brokers>
Once we have everything set up, we can use the Flink CLI to execute our job on our cluster.
flink run -m yarn-cluster -p 2 flink-solr-log-indexer-1.0-SNAPSHOT.jar --properties.file solr_indexer.props
We can start with a low parallelism setting at first (2 in this case) and gradually increase to meet our throughput requirements. With the increase, if parallelism we will probably have to add more task managers and memory as well.
Log Dashboards with Hue
Now that our logs are continuously processed and indexed by our Flink job, the final step is to expose this to end-users via an interactive graphical interface. While Solr itself provides a web interface for searching the logs, we can get much better insights by creating some nice dashboards for our log data. For this, we will use Hue.
Hue is a web-based interactive query editor that enables you to interact with data warehouses. It also comes with some advanced dashboarding capabilities that allow us to monitor our logs over time.
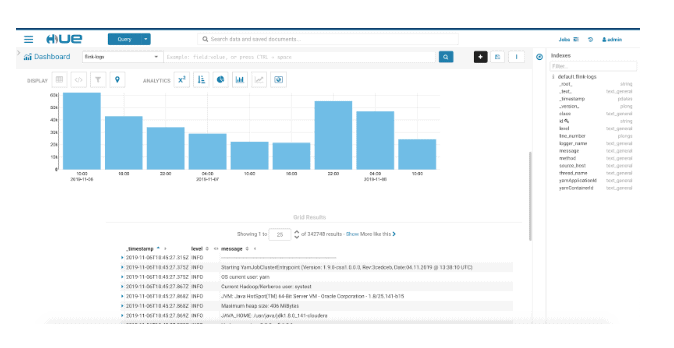
On the Dashboard page, we get immediate access to our Solr collections. On the right-hand side of the screen we can see all the logged fields that are available to us, so we can drag and drop them easily to select what we really need.
We can also create different plots and charts to track different metrics develop over time.
Comparing with other logging Solutions
We have successfully built and deployed a log aggregation pipeline that can be integrated with our data processing applications.
With a bit of extra tuning and care, we can turn this into a decent production system that collects and exposes our logs with low-latency while being scalable. With additions to our log ingestion job, we can also get completely customized features that would be hard to find anywhere else.
On the other hand, there are plenty of off-the-shelf production-grade logging solutions that “just work”. Let’s take a closer look at how our custom solution compares to some existing log aggregation frameworks and how our setup fits together with other tools.
This is not an exhaustive comparison in any means, our intention is not to list all possible solutions out there, but to give you a rough feeling of where we stand.
The ELK stack
The Elasticsearch – Logstash – Kibana (aka ELK) stack is commonly used for collecting and monitoring application logs and metrics. It should satisfy all the log aggregation requirements that our streaming apps have.
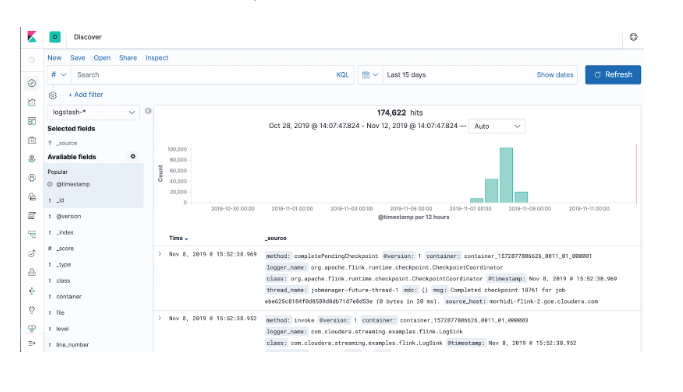
Similarly to our custom pipeline, it comes with its own log ingestion logic using logstash. The logs are stored in elasticsearch. Kibana sits on top of Elastic as a visual dashboarding layer where we can customize our monitoring logic.
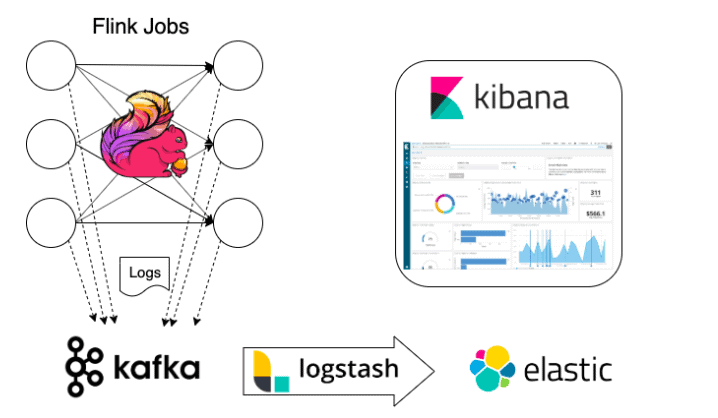
As logstash can be configured to consume logs directly from Kafka, we can reuse the same log appender/collection logic that we have configured for our own custom solution.
The ELK stack is a viable solution if our data processing stack already contains some of these frameworks (Elastic for example). In this case, we just have to take care of setting up Logstash, or a tool like Apache NiFi in a way that matches our desired ingestion logic.
If we want to bring the whole ELK stack as new technology into our organization, we have to be aware of the operational overhead of this choice. As with any other system, it comes with its own set of challenges and costs.
Graylog
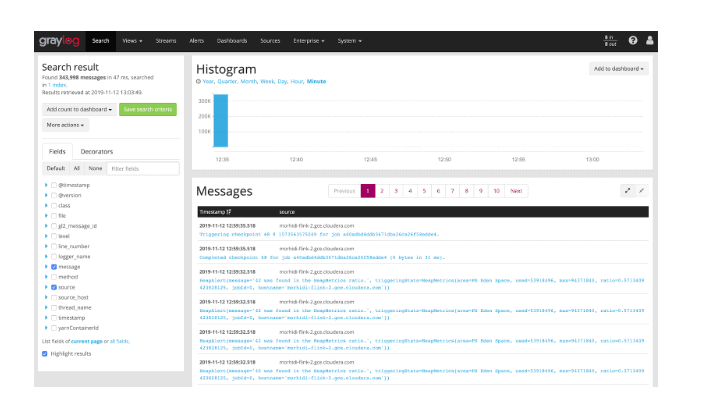
Graylog is a system designed specifically for log aggregation and monitoring. It comes with its own log ingestion logic and custom appenders that can be configured to consume our logs directly.
Similarly to logstash, we can also configure Graylog to consume our log messages from Kafka, which reinforces our choice for Kafka as a log collection layer, no matter what downstream logging stack we use.
Graylog itself stores the log messages in elastic and it uses mongodb to store the metadata of our configuration, dashboards etc.
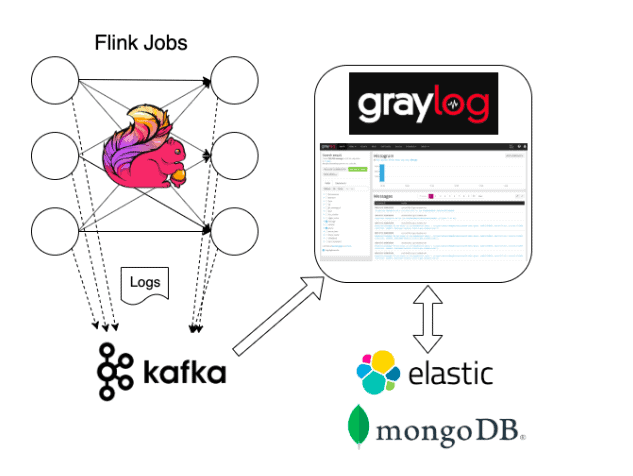
Similar to the ELK stack, Grayloag can be an excellent choice for our logging stack, if we have the expertise to operate the stack at hand.
Wrapping Up
With the help of Flink, we have built a highly scalable and customizable logging solution that meets the special requirements of streaming applications. It aggregates and stores the logs from long-running jobs and provides simple functions for easy monitoring and diagnostics near real-time. The solution can be used as-is in a CDP environment or can be easily integrated into a centralized logging and monitoring system. Flink could also help extend our solution further with alerting capabilities.


