Starting in Cloudera Enterprise 5.5, Cloudera Navigator offers interactive visual analytics that help answer important questions about the data that’s in your CDH clusters.
The new analytics system in Cloudera Navigator shows the distribution of data along various metadata dimensions and supports interactive filtering and grouping with a simple point-and-click interface. This new functionality a great complement to Cloudera Navigator’s search capabilities and is integrated with Navigator’s policy engine, so you can easily understand the impact of data management policies before applying them to your data. For this first version, Navigator offers analytics on HDFS files based on both metadata and audit events.
In the remainder of this blog post, I’ll provide an overview of these new features.
Metadata Analytics
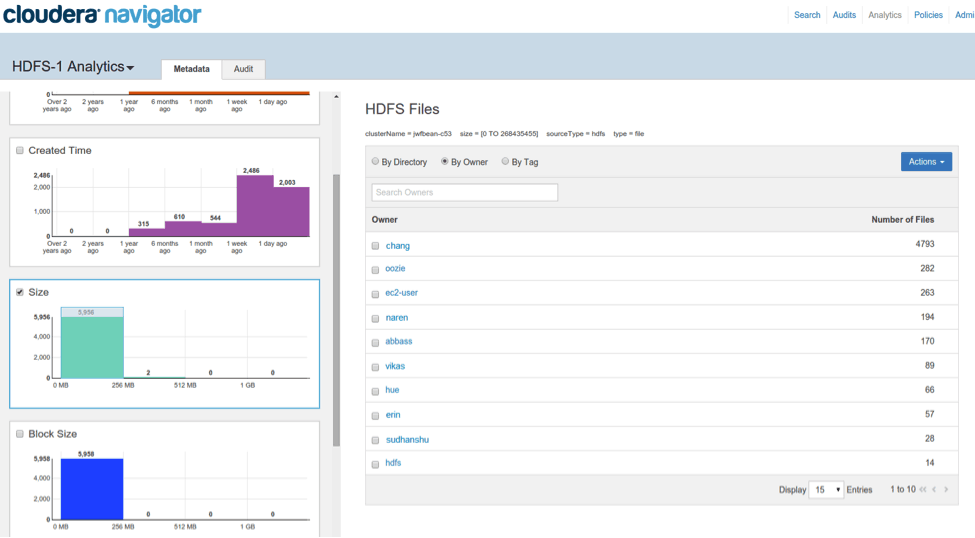
Metadata analytics are based on metadata extracted from HDFS. By default, the distribution of your HDFS files is shown in several histograms that correspond to various technical metadata dimensions like last access time, file size, block size, etc. This gives you visual summaries of data along important dimensions.
By brushing a range on a histogram (e.g., file size), you can select the files that fall within the selected range — and then you can further filter the results by directory, by file owner, or by custom tags; the file count is shown for each group.
Brushing a region of the Size histogram on the left to create a search filter
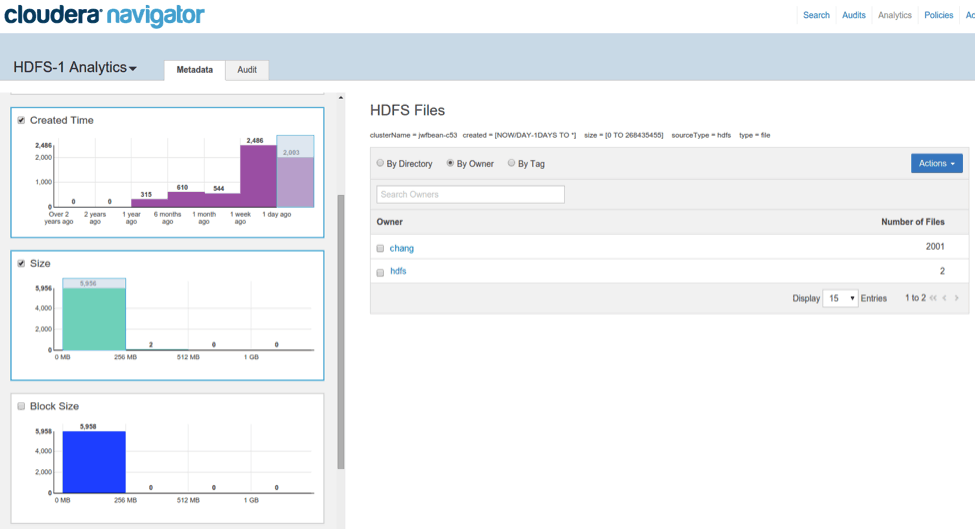
You can also create combined filters along multiple dimensions by brushing regions in multiple histograms. This gives you the flexibility to ask more complex questions like “who are the top owners of small files created yesterday” in a direct and visual manner.
Brushing multiple histograms creates combined filters
Detailed Drill-down via Search Integration
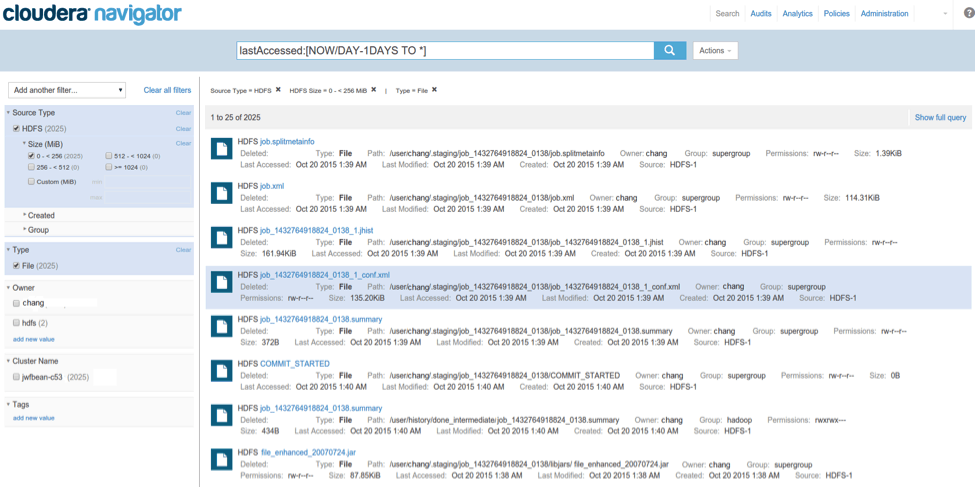
If you want to see the details on the individual files returned by your filters, you can click on the Actions menu on the right and select “Show in search.” This action takes you to the familiar metadata search UI with a pre-populated query that correspond to the exact selections you made in the analytics UI. You can then browse through individual files and examine their details and lineage.
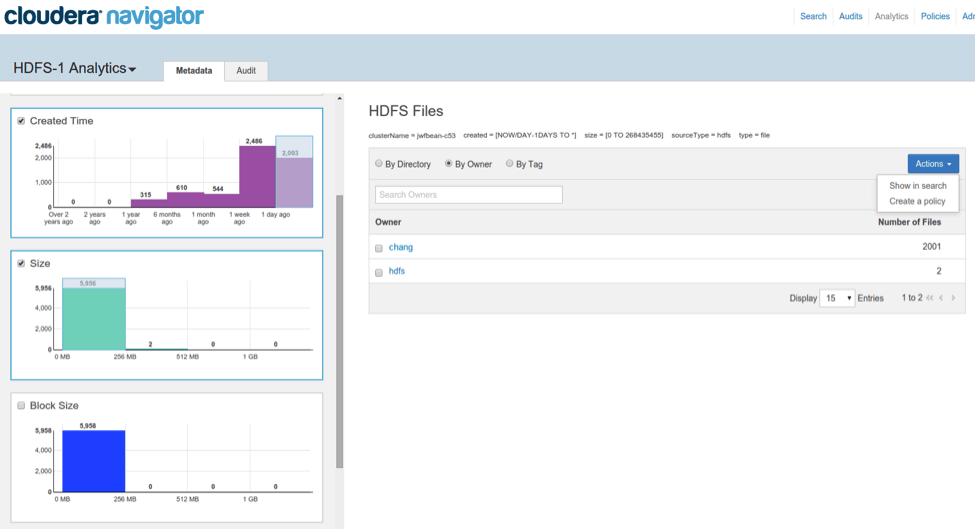
The filters created via brushing the histograms can be used to create a Navigator policy, or analyzed in more detail via Navigator search
Clicking on “Show in Search” pre-populates the search UI with the filters created in the analytics view
Policy Engine Integration for Data Lifecycle Management
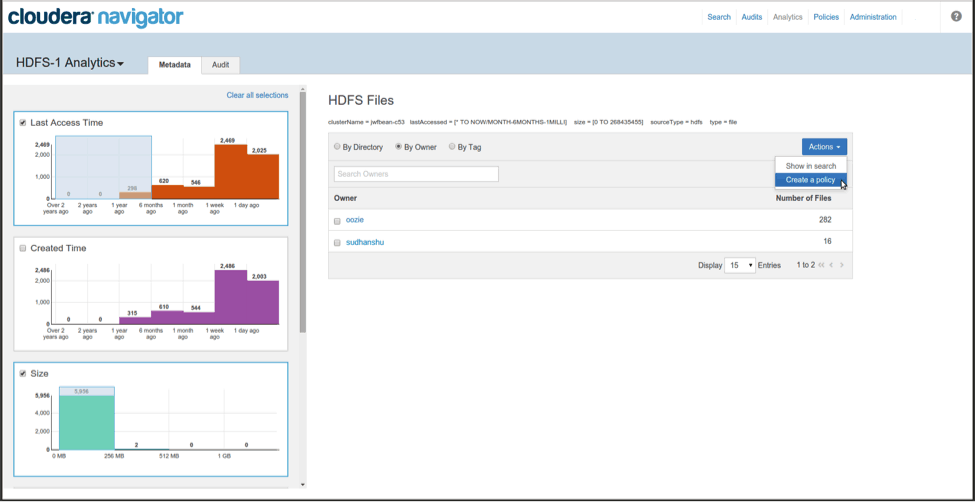
The Actions menu also integrates the Navigator analytics system with the policy engine, giving you a high -evel understanding of the impact of new policies before you create them. As an example, you could select files that haven’t been accessed for more than six months, and set up a recurring policy to automatically archive or delete them at regular intervals.
Analytics UI is integrated with the policy engine
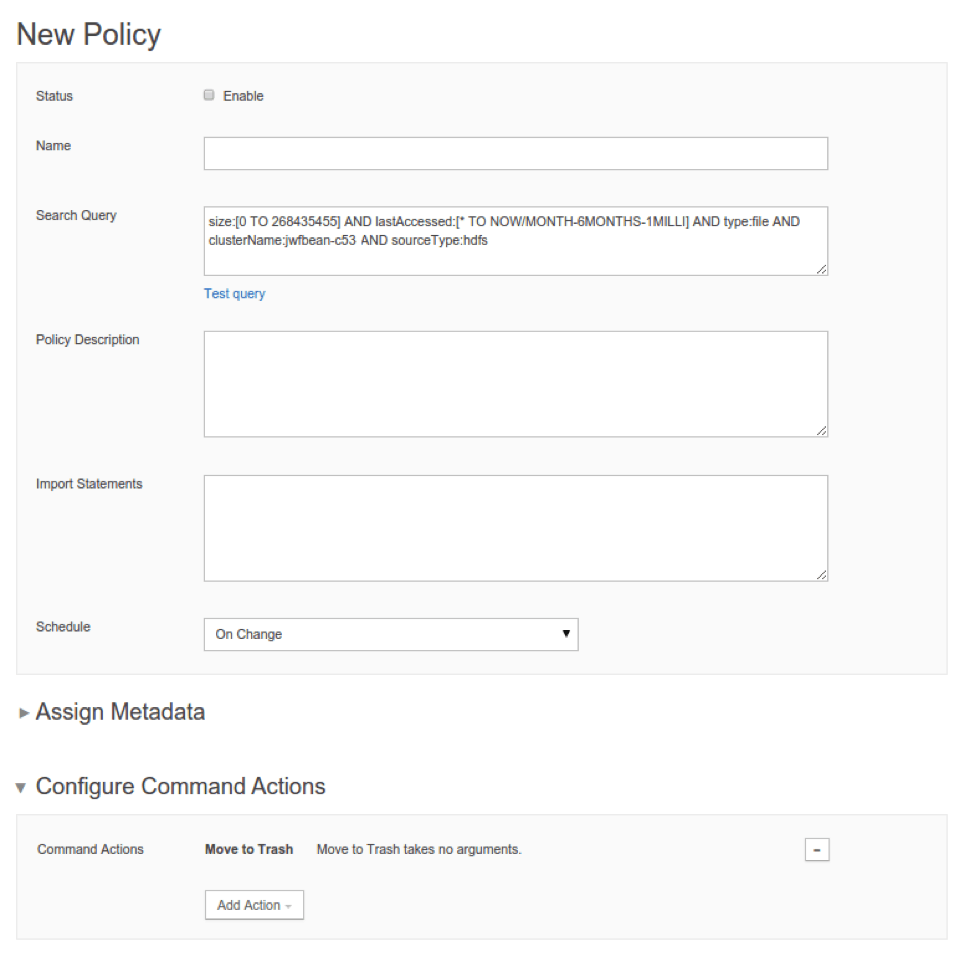
Clicking on “Create a Policy” pre-populates the New Policy creation view with the filters created in the analytics view
Audit Analytics
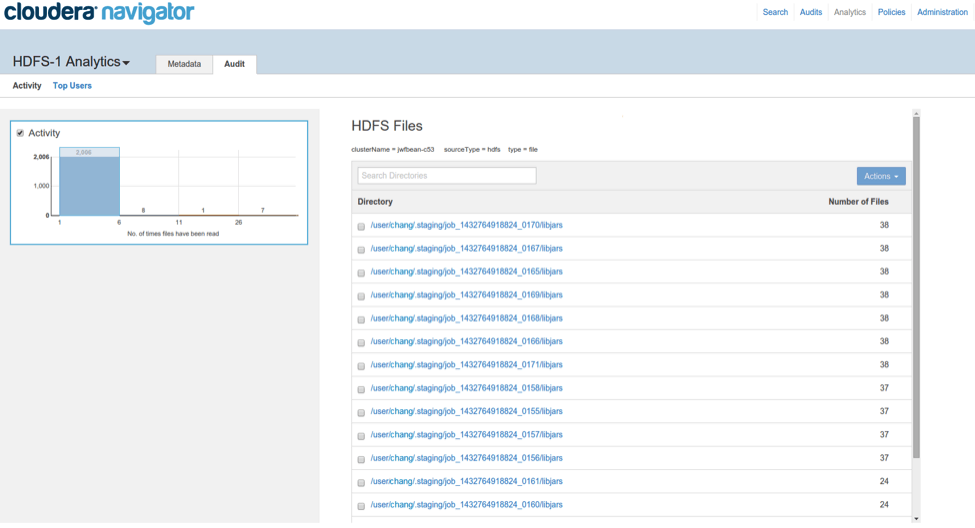
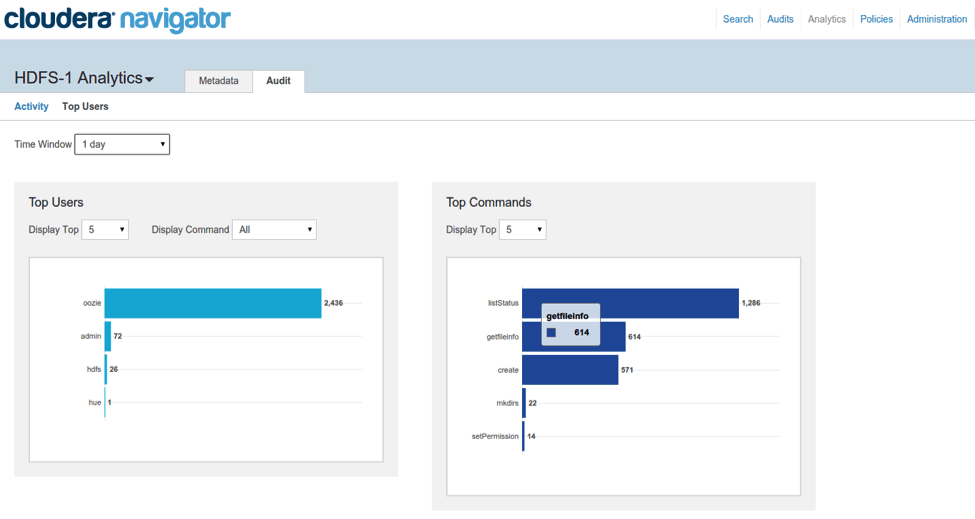
Similar to the metadata analytics, audit analytics summarizes audit events recorded by Cloudera Navigator for HDFS entities. The activity analytics shows the distribution of file reads (HDFS audit events where operation=’open’) over the past week, while the top user analytics show the top users and top commands over short time windows from 1 min up to 1 day.
Activity analytics are based on number of “open” audit events for each file. This is updated daily and results are shown for the top-10K most active files.
“Top Users” analytics are based on all HDFS audit events and is grouped by either user or the command type. These analytics reflect real-time audit events as they are being logged.
Conclusion
By offering interactive visual analytics that update as your HDFS changes, the new Cloudera Navigator analytics feature gives you a bird’s eye view of your data. It offers the ability to easily ask a wide range of questions about your metadata, and it is integrated into Navigator’s policy engine to provide a seamless workflow to help keep your data organized. Finally, while there are lots of future work to be done on extensibility, customization, and additional analytics (e.g., Apache Hive), we’re very excited for you to try out this new feature for data discovery and management, and we’d love to hear your feedback via community.cloudera.com.
Chang She is a Software Engineer at Cloudera, and a major contributor to pandas. Previously, he was a co-founder of DataPad.


