

Like all of our customers, Cloudera depends on the Cloudera Data Platform (CDP) to manage our day-to-day analytics and operational insights. Many aspects of our business live within this modern data architecture, providing all Clouderans the ability to ask, and answer, important questions for the business. Clouderans continuously push for improvements in the system, with the goal of driving up confidence in the data. Trustworthy, reliable data means better questions, and more accurate and predictable outcomes.
With global spend on the public cloud reaching $385 billion in 2021, Cloudera was by no means alone in identifying that we, too, needed to be conscious of the ever-increasing costs of our public cloud infrastructure. Much of Cloudera’s internal research and development infrastructure for CDP Public Cloud and CDP Private Cloud runs on compute and storage from the big three cloud providers, and at the beginning of 2020 costs were on course to top $25 million per year. As we started to assess the impact of the global pandemic, this $25 million offered a tangible opportunity to cut out waste and save money. Our CEO took a personal interest in this top-line number and tasked us with cutting it in half by the end of the year. We were required to report back on a weekly basis with our progress and overall trajectory.
A 2021 survey of business found that 82% are spending far more than they need to on cloud costs, with 86% suggesting that they are unable to easily get a global view of cloud costs. Cloudera was among these companies, and our initial solution was to invest in a combination of complicated spreadsheets and a cloud spend SaaS management tool—which itself was not cheap, but gave us a rapid view of our spend across the clouds. However, we quickly found that our needs were more complex than the capabilities provided by the SaaS vendor and we decided to turn the power of CDP Data Warehouse onto solving our own cloud spend problem.
Project CloudCost—design
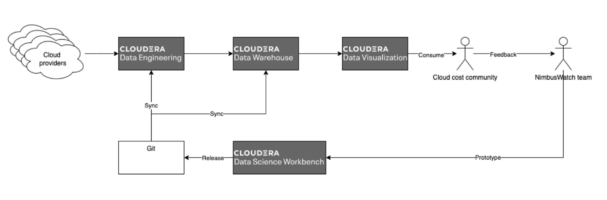
Cloudera runs much of its internal analytics on CDP Private Cloud Base, and this was the natural home for prototyping an automation, monitoring, and governance solution: Project CloudCost.
The goal was to provide a unified single source of truth for all our cloud spending. This was envisioned as a one-stop solution to serve the different personas around cloud cost awareness: from senior leaders down to the frontline engineer.
In the first iteration of Project CloudCost, we ingested data directly from the SaaS vendor but later moved to ingest usage data from the three cloud vendors’ public APIs. This enabled us to ingest data faster, more reliably, and in deeper detail, while saving on licenses. The solution was prototyped in Cloudera Data Science Workbench (CDSW), and is built using Python and PySpark, which is scheduled using Cloudera Data Engineering. This brings data directly into the Data Warehouse, which is stored as Parquet into Hive/Impala tables on HDFS. We were also able to ingest data from our HR and finance systems to build a picture of the hierarchy of the organization so that we could start to apportion costs. Once we had all of this data in one place, we could build up a cost model. Costs for a specific line item of usage could be attributed to:
- Cloud account (we have around 200 cloud accounts, mostly assigned to cost centers, although some are pooled)
- Object owners, which can be mapped back to organizational unit, and therefore cost center
- Tags: we have implemented a company-wide tagging process, which allows us to reassign costs if needed
- Waste identification: special dashboards follow patterns in our consumption and provide actionable intelligence, empowering the owners to spark conversations or directly reach out to the right team to make changes and eliminate waste
We were also able to attribute indirect costs, such as network charges, by joining this data back to instance data that was already tagged, a feature lacking in the SaaS product.
One of the greatest strengths of this design is that if we decide to employ further on-prem or public cloud providers, we can easily add them, and still provide a unified 360-degree view to the responsible owners.
Analytics
The key to gaining business insight and the cost savings that we needed to achieve is to place the analytics into the hands of the users who are able to take advantage of them—in our case this was predominantly engineering managers. To do this, we brought in Cloudera Data Visualization (CDV), which runs on both CDP Private Cloud and CDP Public Cloud. Using CDV, we could very quickly build insightful and interactive dashboards directly on top of our Impala data warehouse.
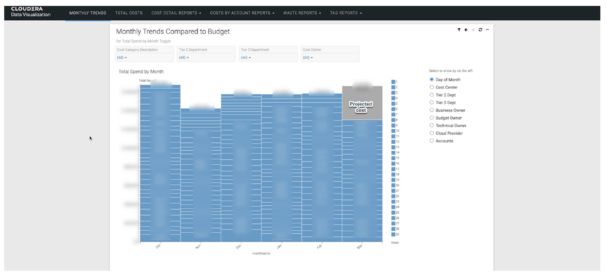
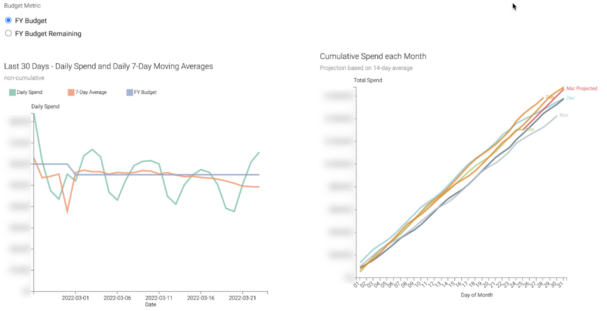
With our CDV dashboards we now see the day-by-day spend, trends in moving averages, and also month-on-month and month-end forecast views. These visualizations transformed the conversations with the CEO because we could now accurately assess and report our run rate and provide end-of-month forecasts at a glance.
Once we’d given users visual representations of the spend, they began asking for help generating insights as to where waste was coming from. Quickly, we could build dashboards looking at areas for improvement, such as weekend shutdowns.
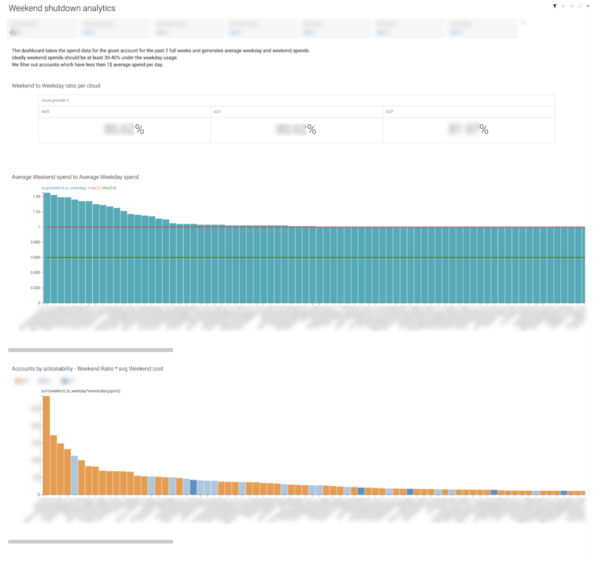
By analyzing the ratio of weekday to weekend spend, we can rapidly identify areas and departments where we can target waste. We also created waste reports looking at spot instance usage, idle, or over-provisioned instances that haven’t been cleared up.
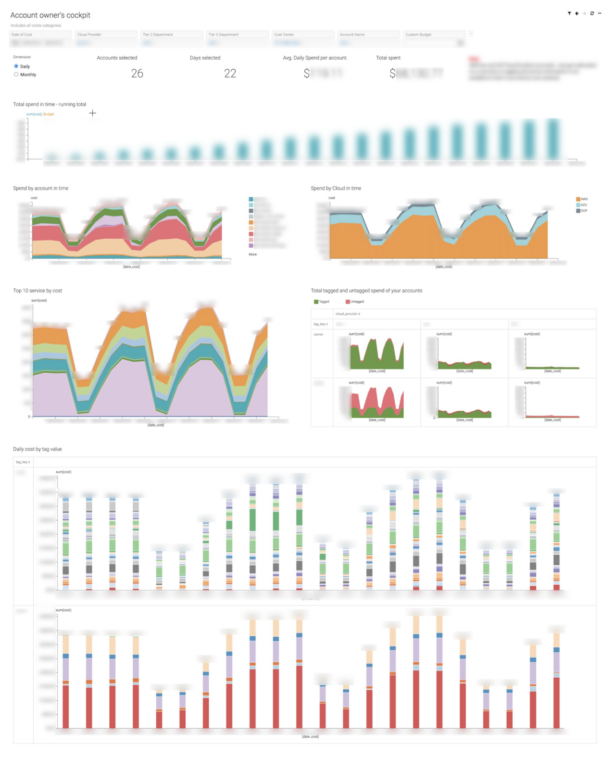
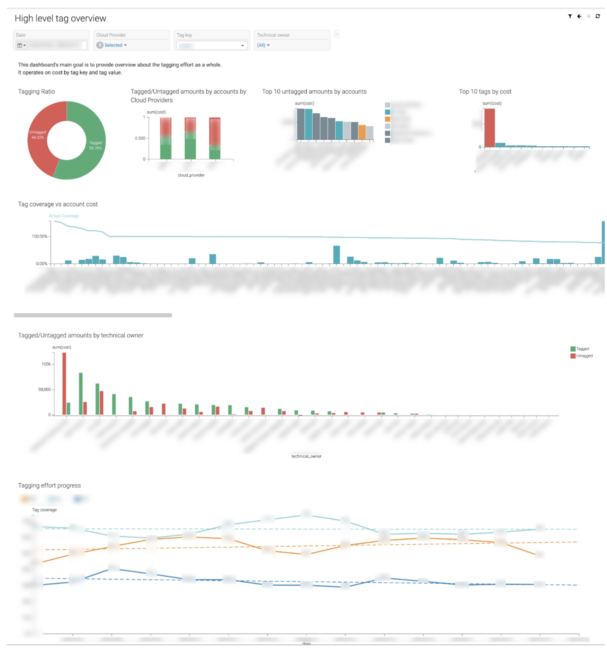
One of the core requirements to successfully understand your cloud spend is having your resources properly tagged. Unsurprisingly, not many cloud vendors will actually help you do this. Not only does our solution provide an operational understanding of cost distribution based on the tags, but also drives the tagging effort by enabling technical managers to have an overview of their accounts.
Finally, we’re able to put weekly reports into engineering managers’ inboxes, showing their spend, trajectory, and highlighting areas for improvement or waste reduction. This has been critical to helping managers proactively manage costs, rather than reacting at the end of each month. CDV supports sophisticated rule and threshold-based email sending, which some of our technical owners utilize to set up personalized alerts to the actual team generating the cost.
Outcomes
Two main outcomes arose from this work: cost savings and better situational awareness.
First, by putting the data into managers’ hands, we were able to generate large cost savings very quickly. An individual manager could easily identify cost issues. In our Amazon AWS cloud environments, examples included AWS RDS instances that weren’t being used, S3 buckets that had long been forgotten about, or un-reaped proof-of-concept clusters that had been provisioned for a specific demo period and were quietly costing non-trivial amounts of money on data egress charges. Our overall month-on-month run rate came down from around $2 million per month to less than $1 million per month during 2021. This decrease enabled us to reprioritize funding and increase spending in areas where the business required. For example, our regression test framework can burst into the cloud, allowing us to carry out testing on a greater proportion of our support matrix.
Second, creating a single source of truth that anyone can access has also enabled our teams to avoid reinventing the wheel. As CDV makes the data easy to consume for everyone from senior management to the frontline engineers alike, people now turn to this central tool instead of wasting their time—sometimes in separate parallel efforts—to try to understand and create tooling around their team’s cost.
What next?
Now that we connect directly to the cloud providers’ APIs, we can pull data in more regularly and indeed take events from sources like AWS CloudTrail and perform in-flight analytics and alerting using tools in the portfolio such as Cloudera Streaming Analytics powered by Apache Flink. We will continue to generate new waste reports and make it easier for managers and budget holders to create actionable insights and be accountable for their spend.
Additionally, we are working on expanding Project CloudCost to explore other means of cost savings, provide more action-guiding data, and provide more detailed guidance and feedback to the engineers driving this cloud cost.
We are actively working with our cloud cost technical owners to help them do their jobs even more efficiently, and we listen to their needs and implement them.
Our next biggest step is to bring in fine-grained data, down to hourly and machine level, to open the next era for understanding our cloud cost even better. The better we understand what’s occurring, the better decisions we’ll make when managing spend and driving down day-to-day costs. When we can do this, we can put resources where they matter most.
Summary
Cloudera’s Professional Services team built Project CloudCost, a tool based on Cloudera Data Warehouse, Cloudera Data Engineering, and Cloudera Data Visualization. Project CloudCost allowed us to proactively monitor and manage our public cloud spend down from $25 million annually to $12 million per year, and to decommission a cloud spend SaaS product for which we were spending $400,000 annually. Cloudera Data Platform has enabled us to put analytics into the hands of our users and for them to take ownership of what was previously extremely complex data.
If you’d like to discuss how Cloudera Professional Services enables customized use cases like Project CloudCost please get in touch.
Thanks should be given to the following people who have contributed to Project CloudCost over the past two years: Tristan Stevens, Richa Ranjan, Firas Khorchani, Dániel Omaisz-Takács, Juno Schaser, and Sushil Thomas with management sponsorship from Steve Dean, Wendy Turner, and Jim Burtt.
Editor's Choice

