

Have you ever wondered how massive business and consumer apps handle that kind of scale with concurrent users? To deploy high-performance applications at scale, a rugged operational database is essential. Cloudera Operational Database (COD) is a high-performance and highly scalable operational database designed for powering the biggest data applications on the planet at any scale. Powered by Apache HBase and Apache Phoenix, COD ships out of the box with Cloudera Data Platform (CDP) in the public cloud. It’s also multi-cloud ready to meet your business where it is today, whether AWS, Microsoft Azure, or GCP.
Support for cloud storage is an important capability of COD that, in addition to the pre-existing support for HDFS on local storage, offers a choice of price performance characteristics to the customers.
To understand how COD delivers the best cost-efficient performance for your applications, let’s dive into benchmarking results comparing COD using cloud storage vs COD on premises.
Test Environment:
The performance comparison was done to measure the performance differences between COD using storage on Hadoop Distributed File System (HDFS) and COD using cloud storage. We tested for two cloud storages, AWS S3 and Azure ABFS. These performance measurements were done on COD 7.2.15 runtime version.
The performance benchmark was done to measure the following aspects:
- Read-write workloads
- Read only workloads
The following configuration was used to setup a sidecar cluster:
- Runtime version: 7.2.15
- Number of worker nodes: 10
The cluster running with HBase on cloud storage was configured with a combined bucket cache size across the cluster as 32TB, with L2 bucket cache configured to use file-based cache storage on ephemeral storage volumes of 1.6TB capacity each. We ensured that this bucket cache was warmed up almost completely, i.e. all the regions on all the region servers were read into the bucket cache. This is done automatically whenever the region servers are started.
All the tests were run using YCSB benchmarking tool on COD with the following configurations:
- Amazon AWS
- COD Version: 1.22
- CDH: 7.2.14.2
- Apache HBase on HDFS
- No. of master nodes: 2 (m5.8xlarge)
- No. of leader nodes: 1 (m5.2xlarge)
- No. of gateway nodes: 1 (m5.2xlarge)
- No. of worker nodes: 20 (m5.2xlarge) (Storage as HDFS with HDD)
- Apache HBase on S3
- No. of master nodes: 2 (m5.2xlarge)
- No. of leader nodes: 1 (m5.2xlarge)
- No. of gateway nodes: 1 (m5.2xlarge)
- No. of worker nodes: 20 (i3.2xlarge) (Storage as S3)
- Microsoft Azure
- Apache HBase on HDFS
- No. of master nodes: 2 (Standard_D32_V3)
- No. of leader nodes: 1 (Standard_D8_V3)
- No. of gateway nodes: 1 (Standard_D8_V3)
- No. of worker nodes: 20 (Standard_D8_V3)
- Apache Hbase on ABFS
- No. of master nodes: 2 (Standard_D8a_V4)
- No. of leader nodes: 1 (Standard_D8a_V4)
- No. of gateway node: 1 (Standard_D8a_V4)
- No. of worker nodes: 20 (Standard_L8s_V2)
- Apache HBase on HDFS
Here is some important information regarding the test methodology:
- Data size
- 20 billion rows =~20TB
- Table was loaded from 10 sidecar worker nodes (2 billion rows per sidecar node) onto 20 COD DB cluster worker nodes
- Performance benchmarking was done using the following YCSB workloads
- YCSB Workload C
- 100% read
- YCSB Workload A
- Update heavy workload
- 50% read, 50% write
- YCSB Workload C
- YCSB Workload F
- Read-Modify-Update workload
- 50% read, 25% update, 25% read-modify-update
The following parameters were used to run the workloads using YCSB:
- Each workload was run for 15 min (900 secs)
- Sample set for running the workloads
- 1 billion rows
- 100 million batch
- Following factors were considered while carrying out the following performance runs:
- Overall CPU activity was below 5% before starting the run to ensure no major activities were ongoing on the cluster
- Region server cache was warmed up (in case of Amazon AWS, with S3 and in case of Microsoft Azure, with ABFS) to the full capacity ensuring maximum amount of data was in cache
- No other activities like major compaction were happening at the time of starting the workloads
Important findings
The test started by loading 20TB of data into a COD cluster running HBase on HDFS. This load was carried out using the 10 node sidecar on the 20 node COD cluster running HBase on HDFS. Subsequently, a snapshot of this loaded data was taken and restored to the other COD clusters running HBase on Amazon S3 and Microsoft Azure ABFS. The following observations were made during this activity:
- Loading times = 52 hrs
- Snapshot time
- Cluster to cluster = ~70 min
- Cluster to cloud storage = ~70 min
- Cloud storage to cluster = ~3hrs
Key takeaways
The following table shows the throughput observed on running the performance benchmarks:
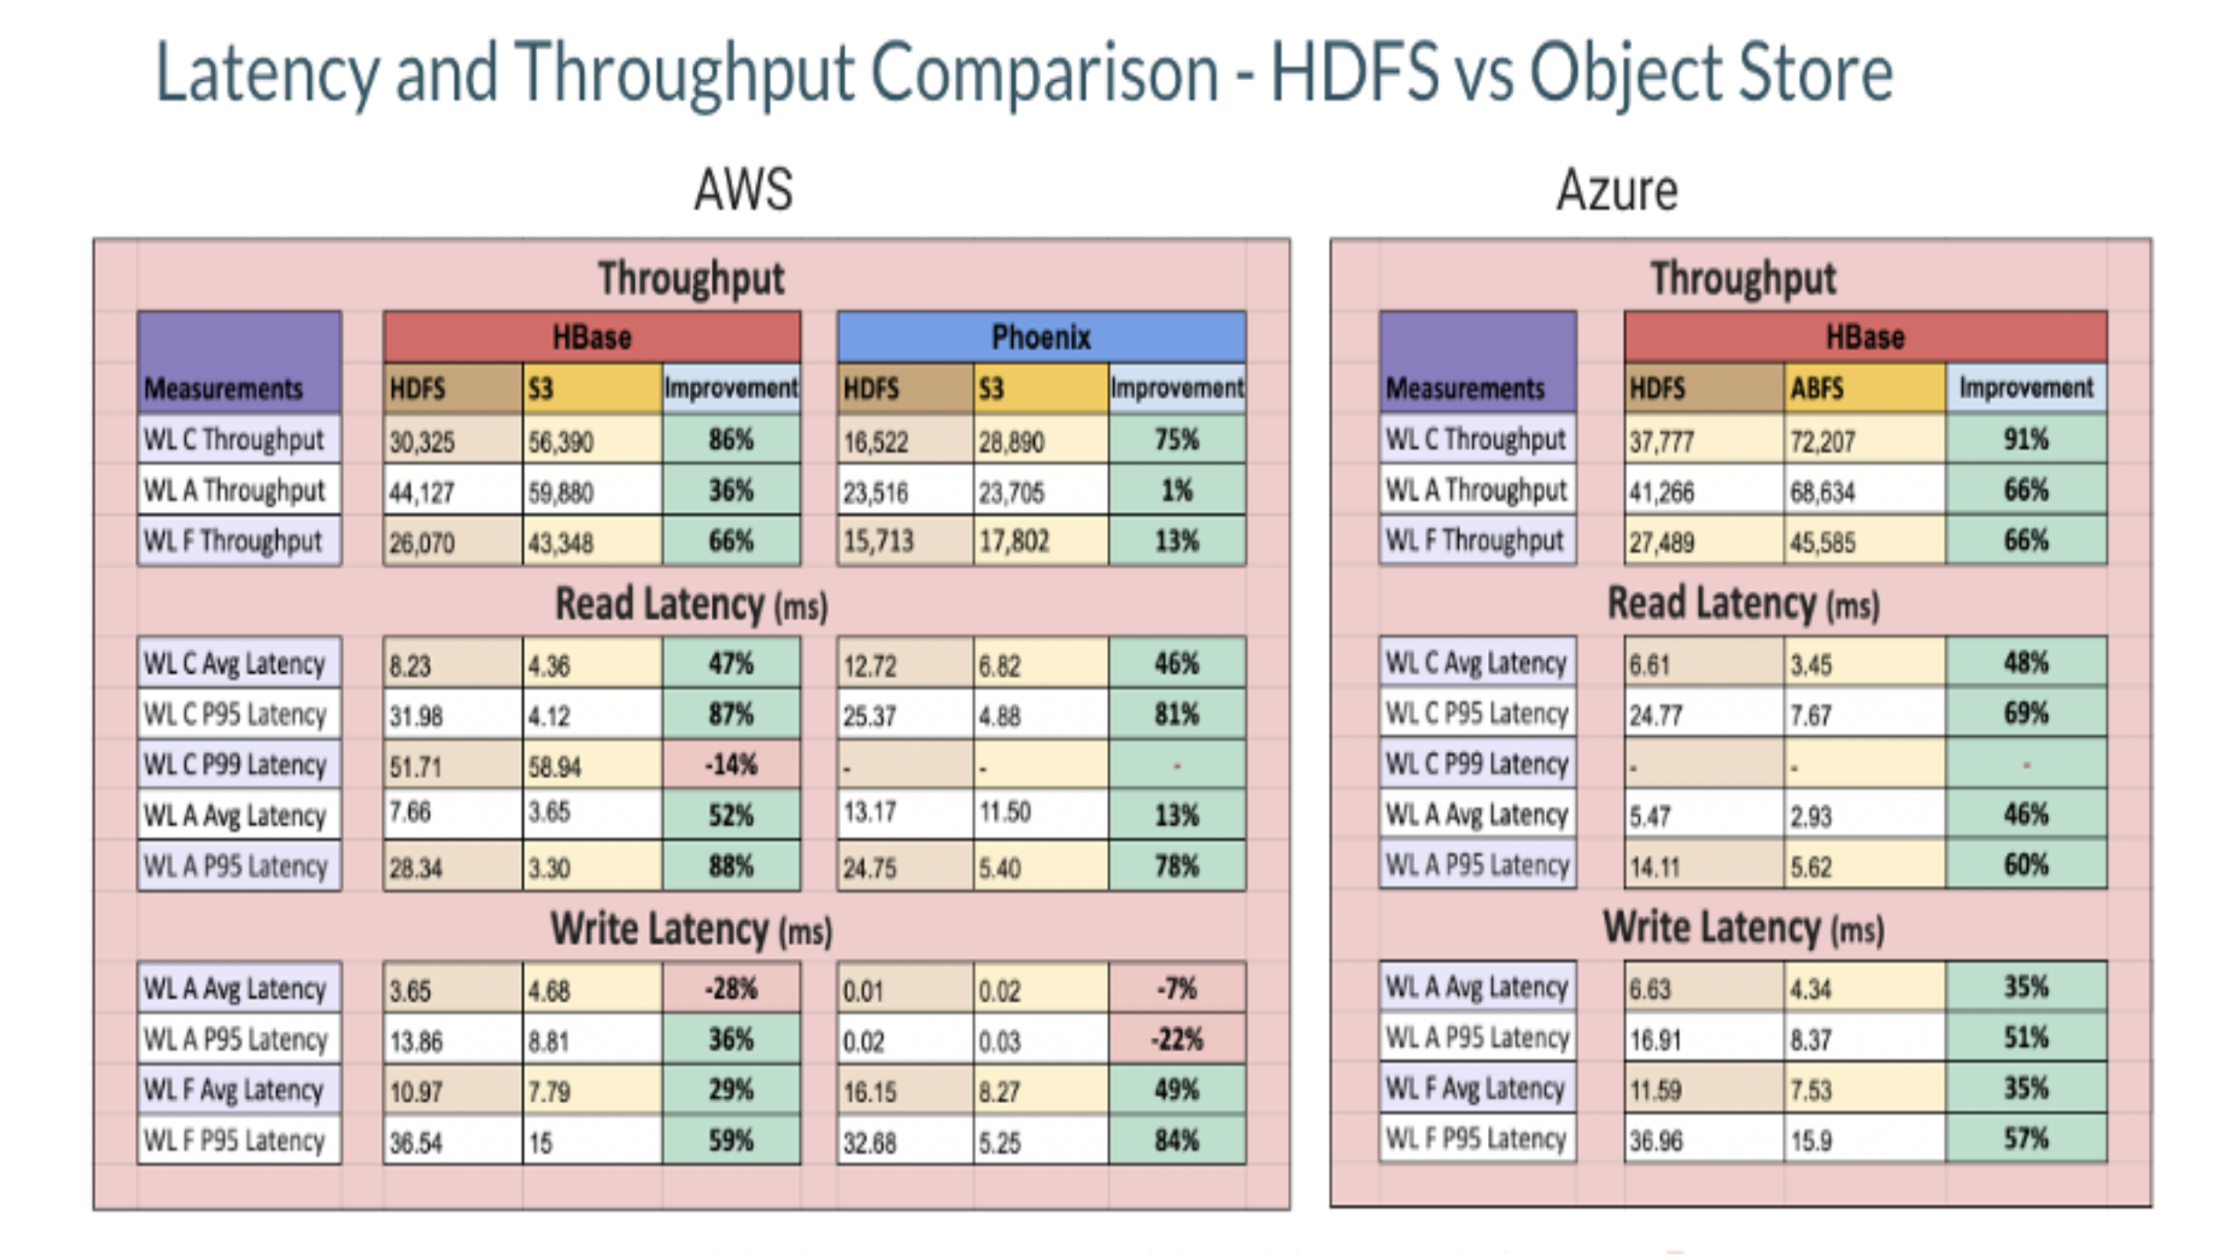
Based on the data shown above, we made the following observations:
- Overall, the average performance was better for a S3 based cluster with ephemeral cache by a factor of 1.7x as compared to HBase running on HDFS on HDD.
- Read throughput for S3 based cluster is better by around 1.8x for both HBase and Phoenix as compared to the HDFS based cluster.
- Some factors that affect the performance of S3 are:
- Cache warming on S3: The cache should be warmed up to its capacity to get the best performance.
- AWS S3 throttling: With the growing number of region servers and hence, the number of network requests to S3, AWS may throttle some requests for a few seconds which may affect the overall performance. These limits are set on AWS resources for each account.
- Non atomic operations: Some operations like move do a lot of data copy instead of a simple rename and HBase relies heavily on these operations.
- Slow bulk delete operations: For each such operation, the driver has to perform several operations like listing, creating, deleting which results in a slower performance.
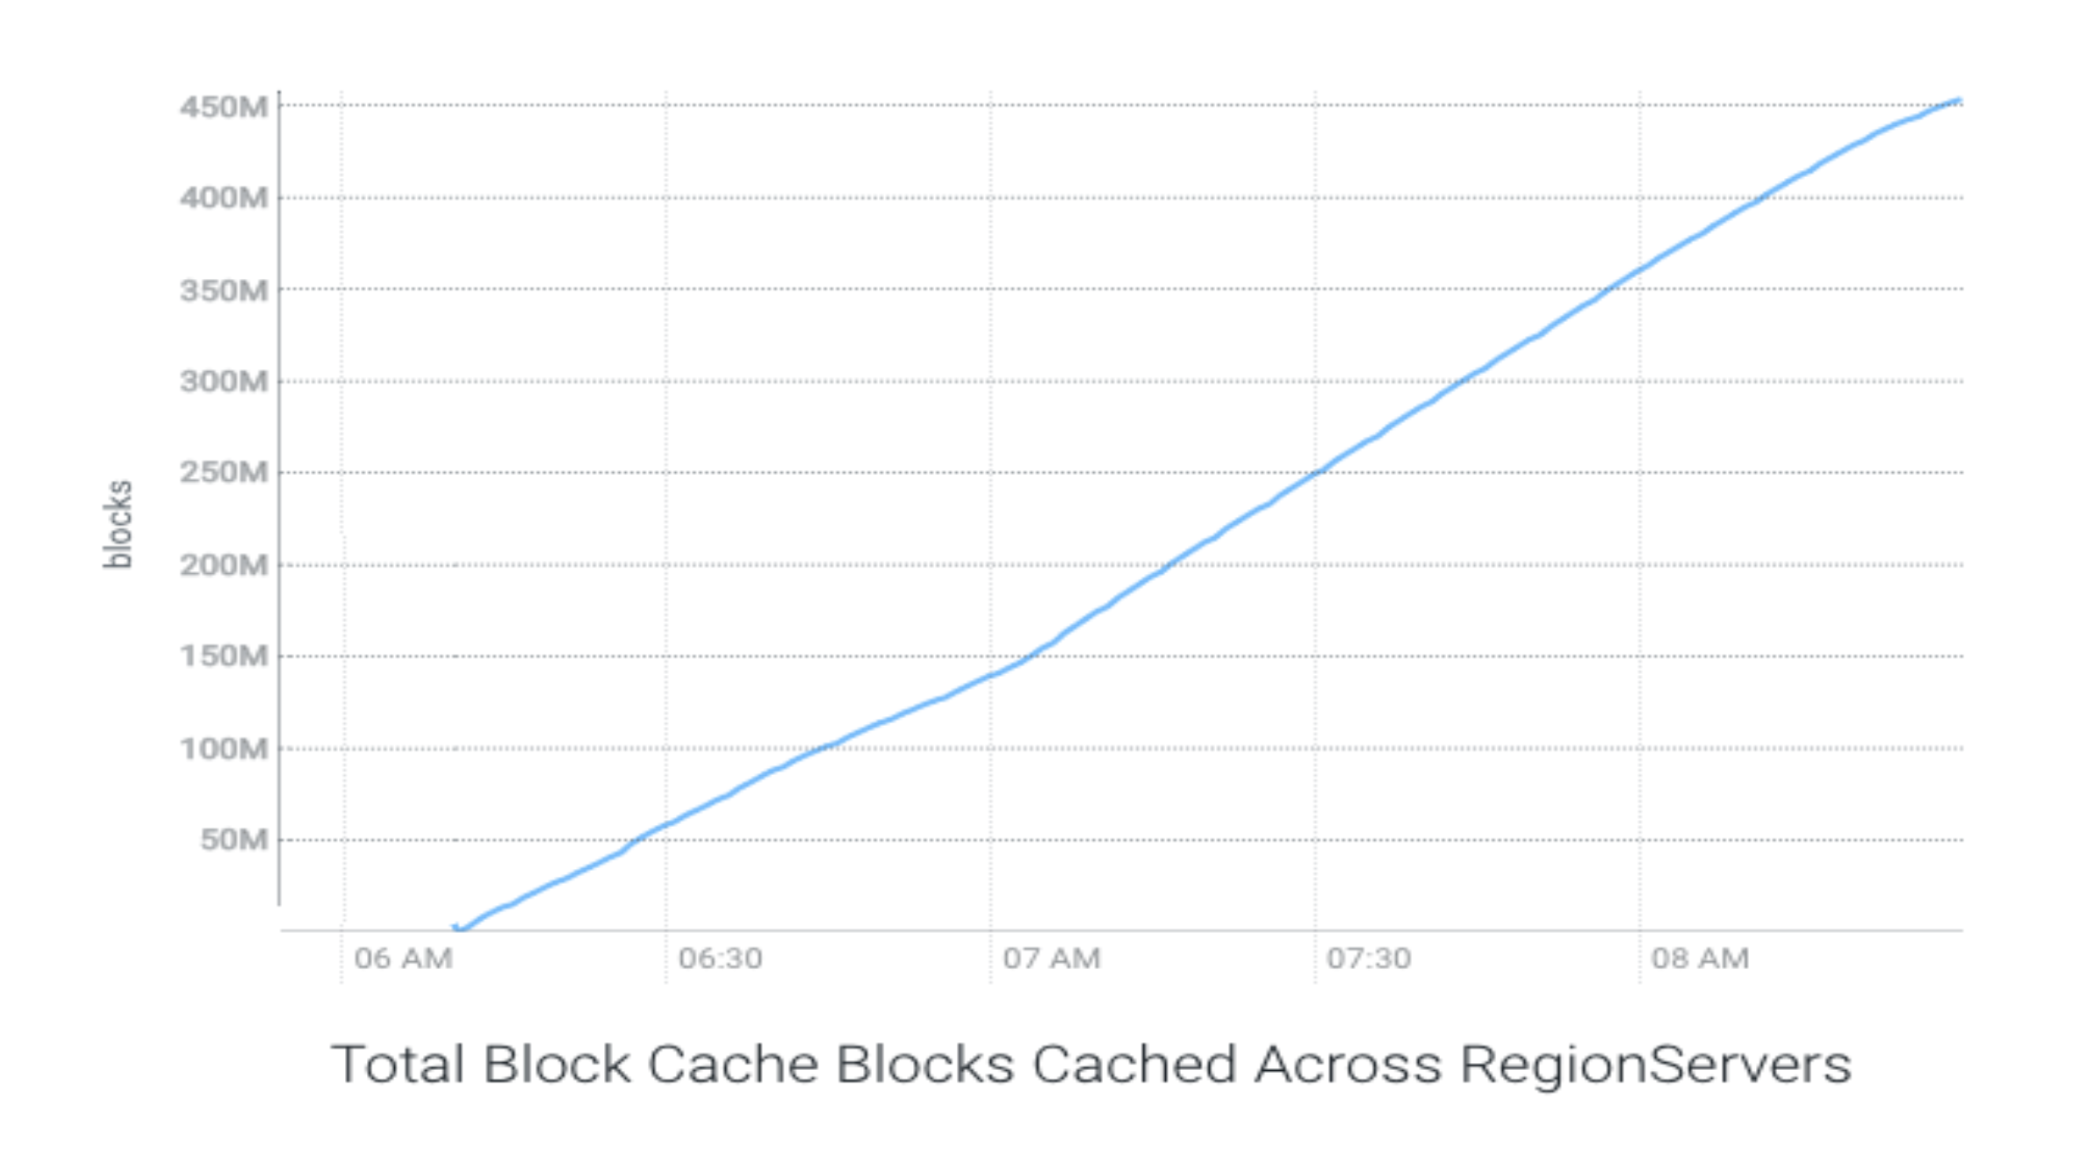
As mentioned above, the cache was warmed to its full capacity in case of S3 based cluster. This cache warming took around 130 minutes with an average throughput of 2.62 GB/s.
The following chart shows the cache warming throughput with S3:
The following charts show the throughput and latencies observed in different run configurations:
The following few charts show comparative representation of various parameters when HBase is running on HDFS as compared to HBase running on S3.
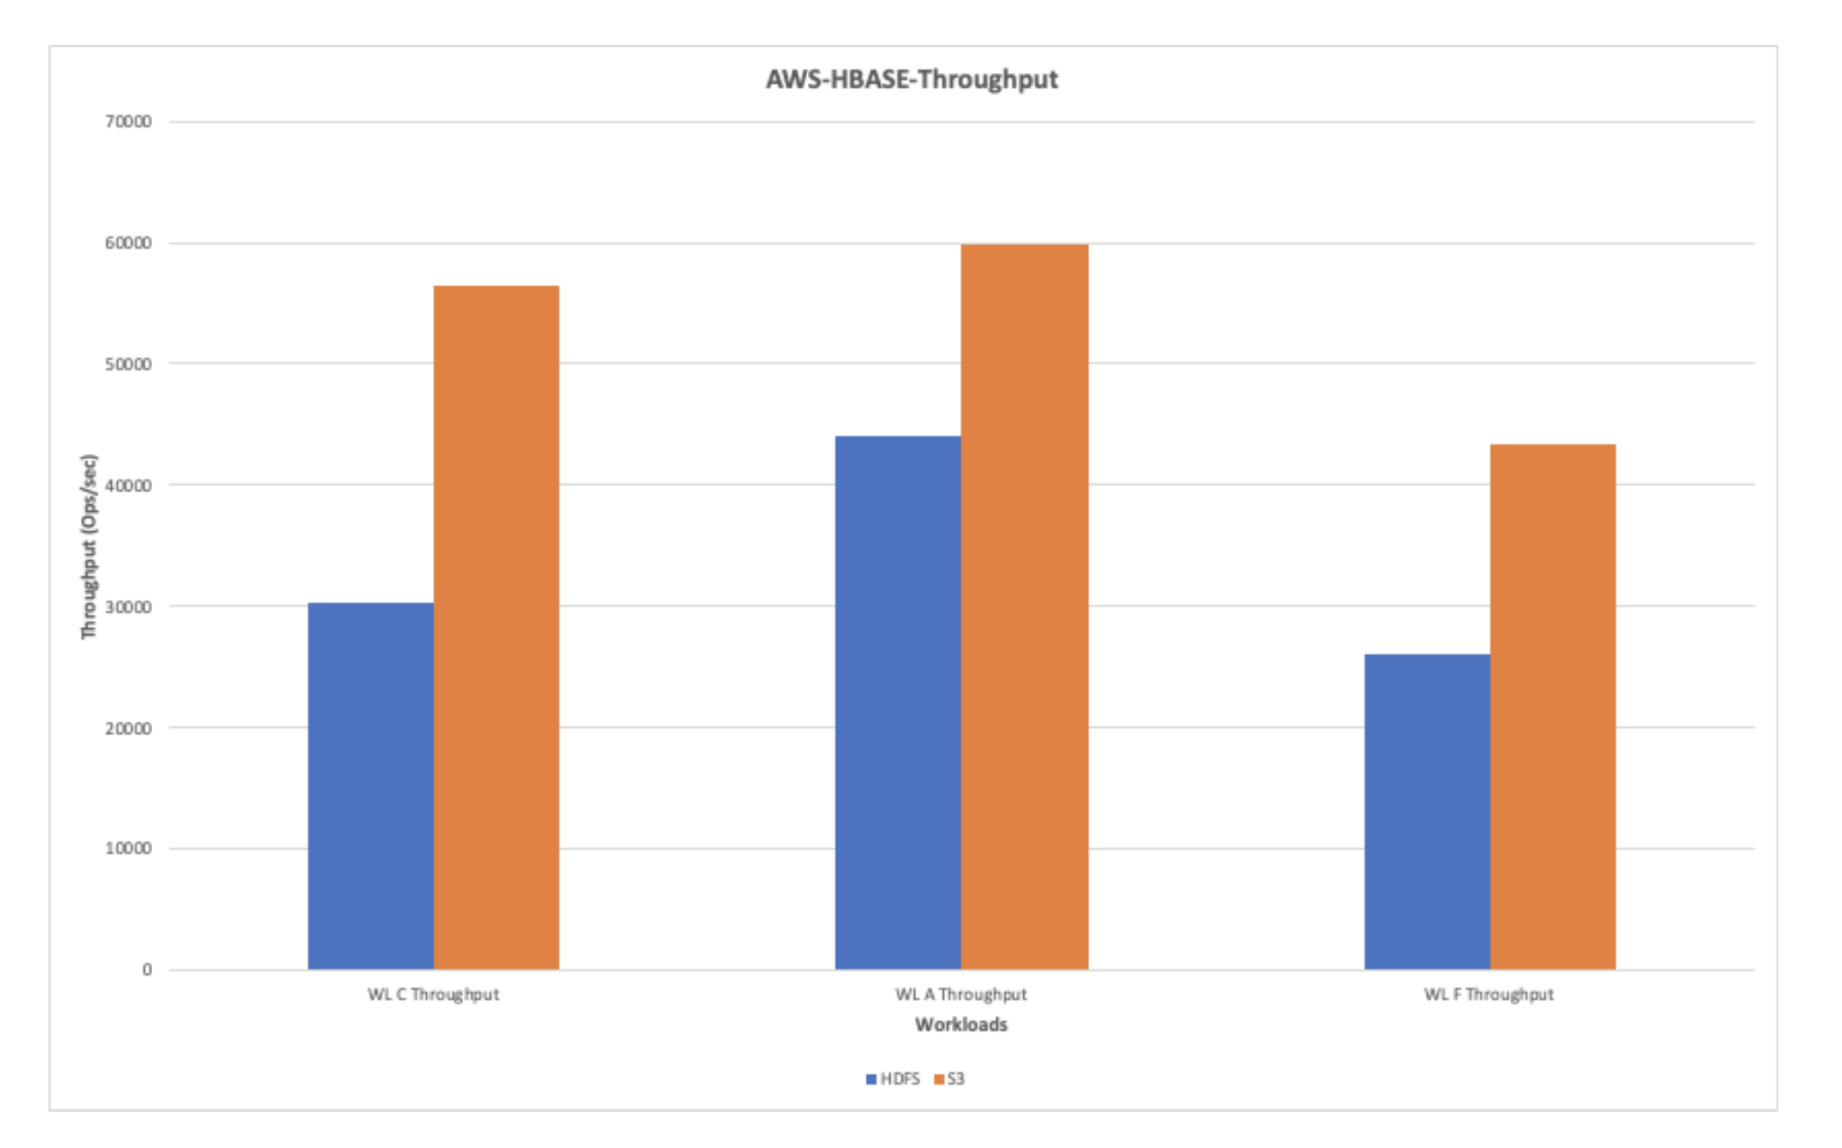
AWS-HBase-Throughput (Ops/sec)
The following chart shows the throughput observed while running workloads on HDFS and AWS S3. Overall, AWS shows a better throughput performance as compared to HDFS.
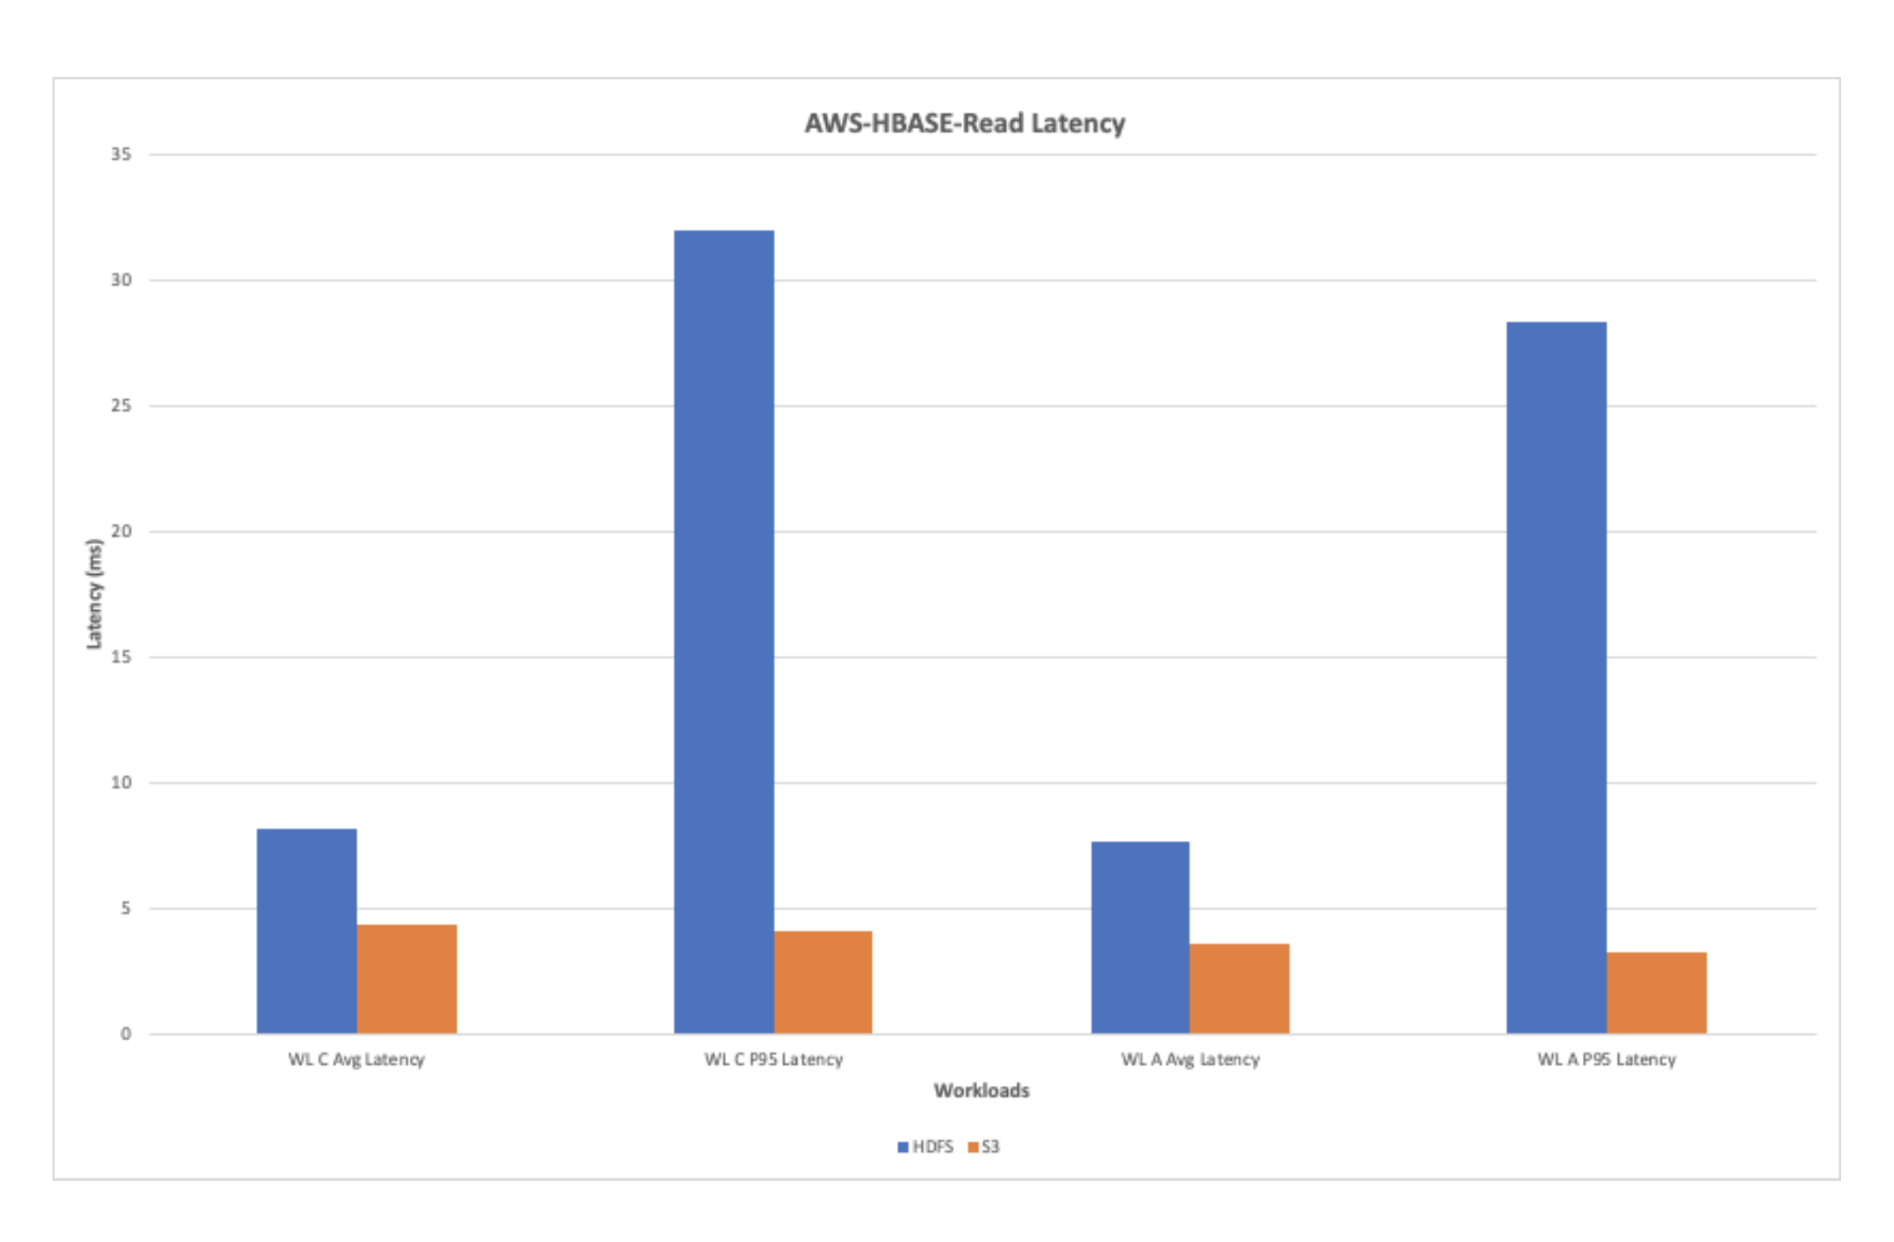
AWS-HBase-Read Latency
The chart below shows the read latency observed while running the read workloads. Overall, the read latency is improved with AWS with ephemeral storage when compared to the HDFS.
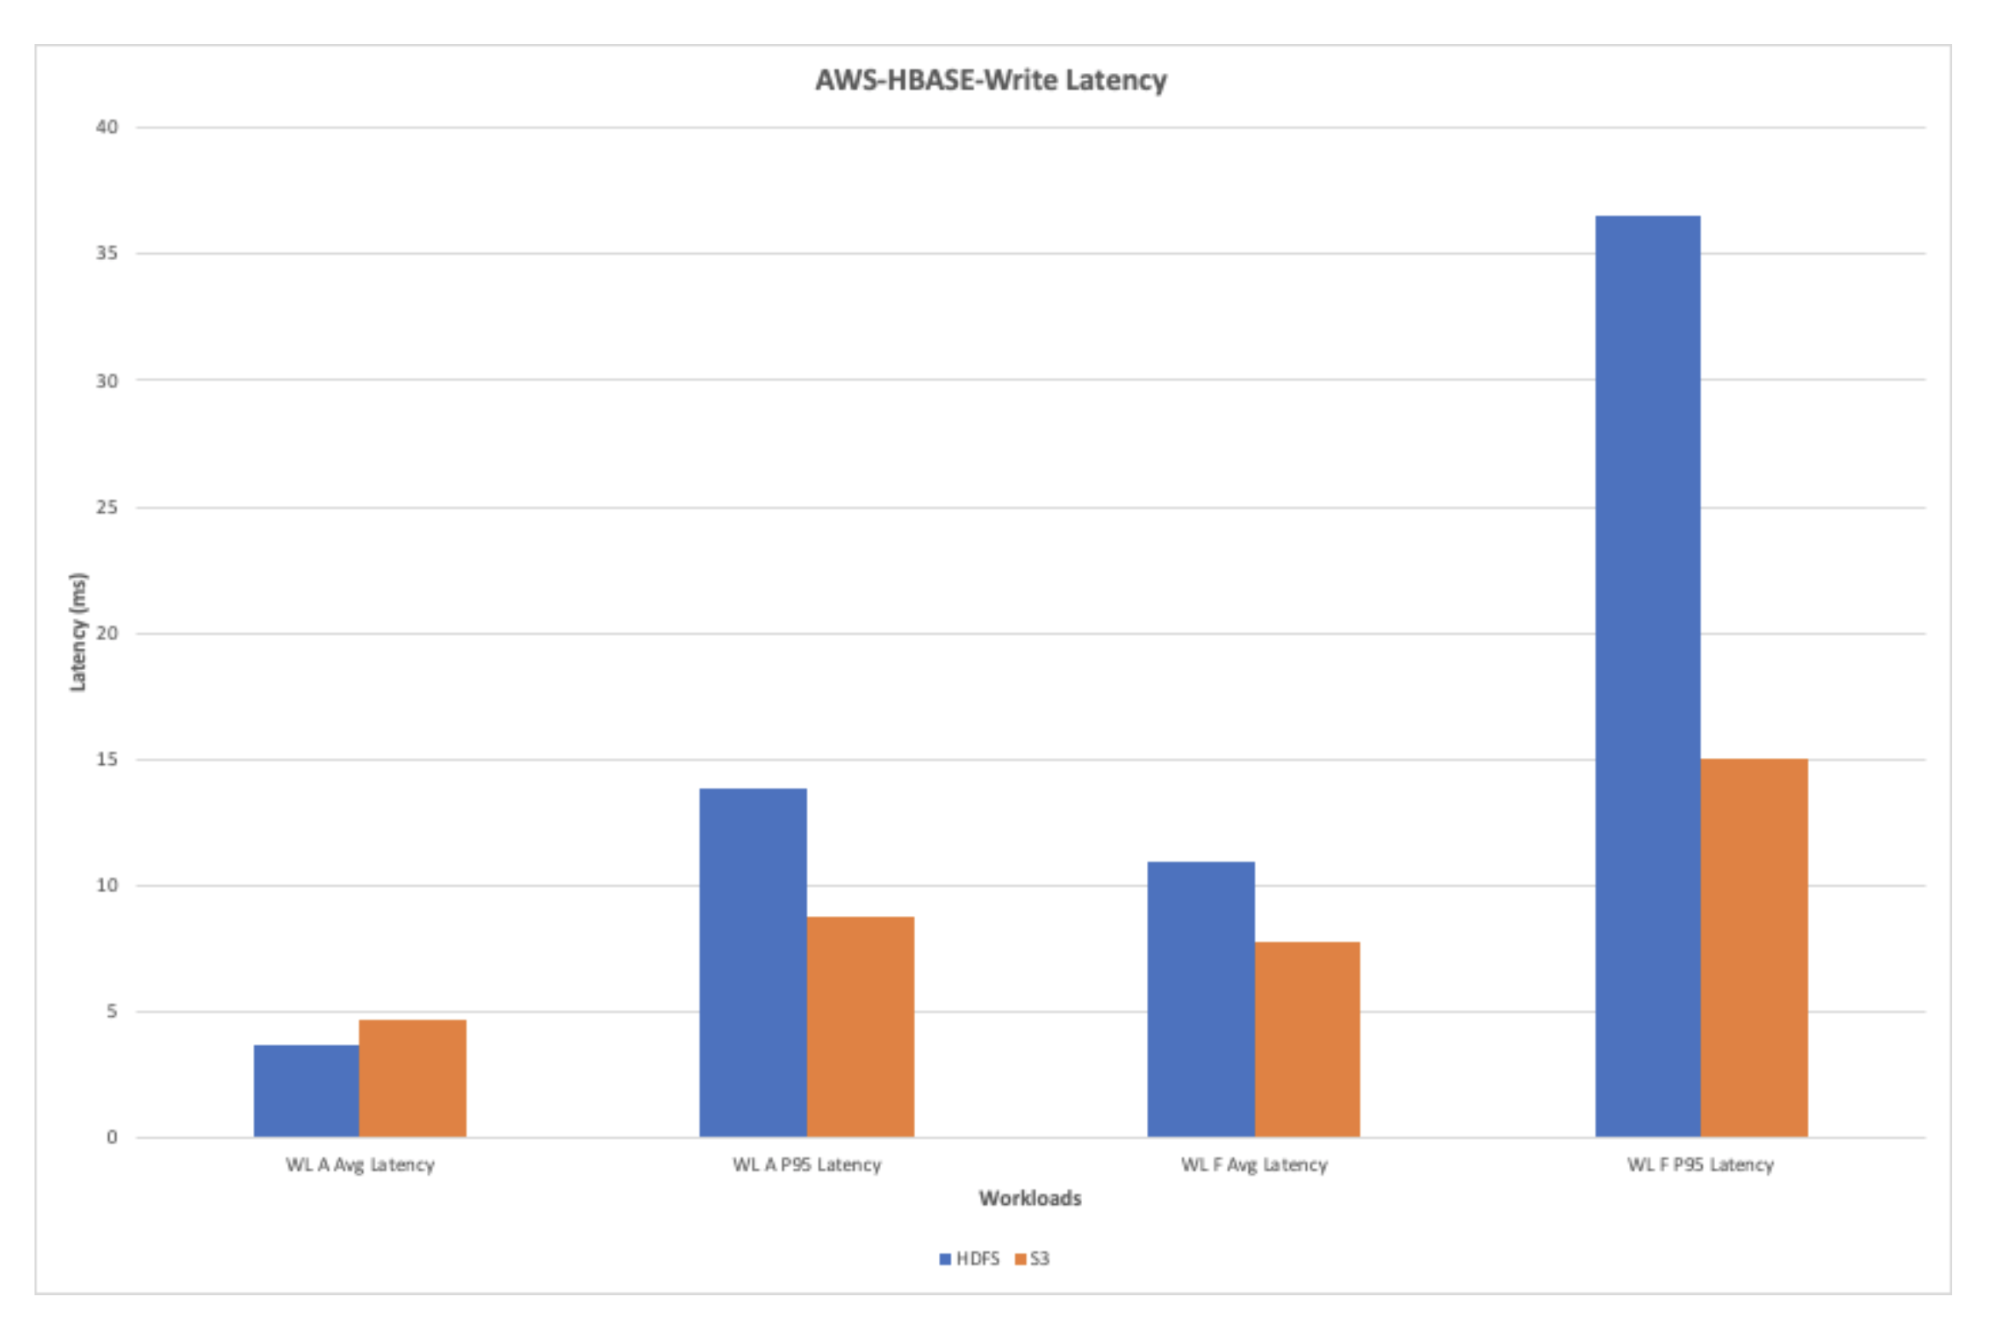
AWS-HBase-Write Latency
The chart below shows the write latency observed while running the workloads A and F. The S3 shows an overall improvement in the write latency during the write heavy workloads.
The tests were also run to compare the performance of Phoenix when run with HBase running on HDFS as compared to HBase running on S3. The following charts show the performance comparison of a few key indicators.
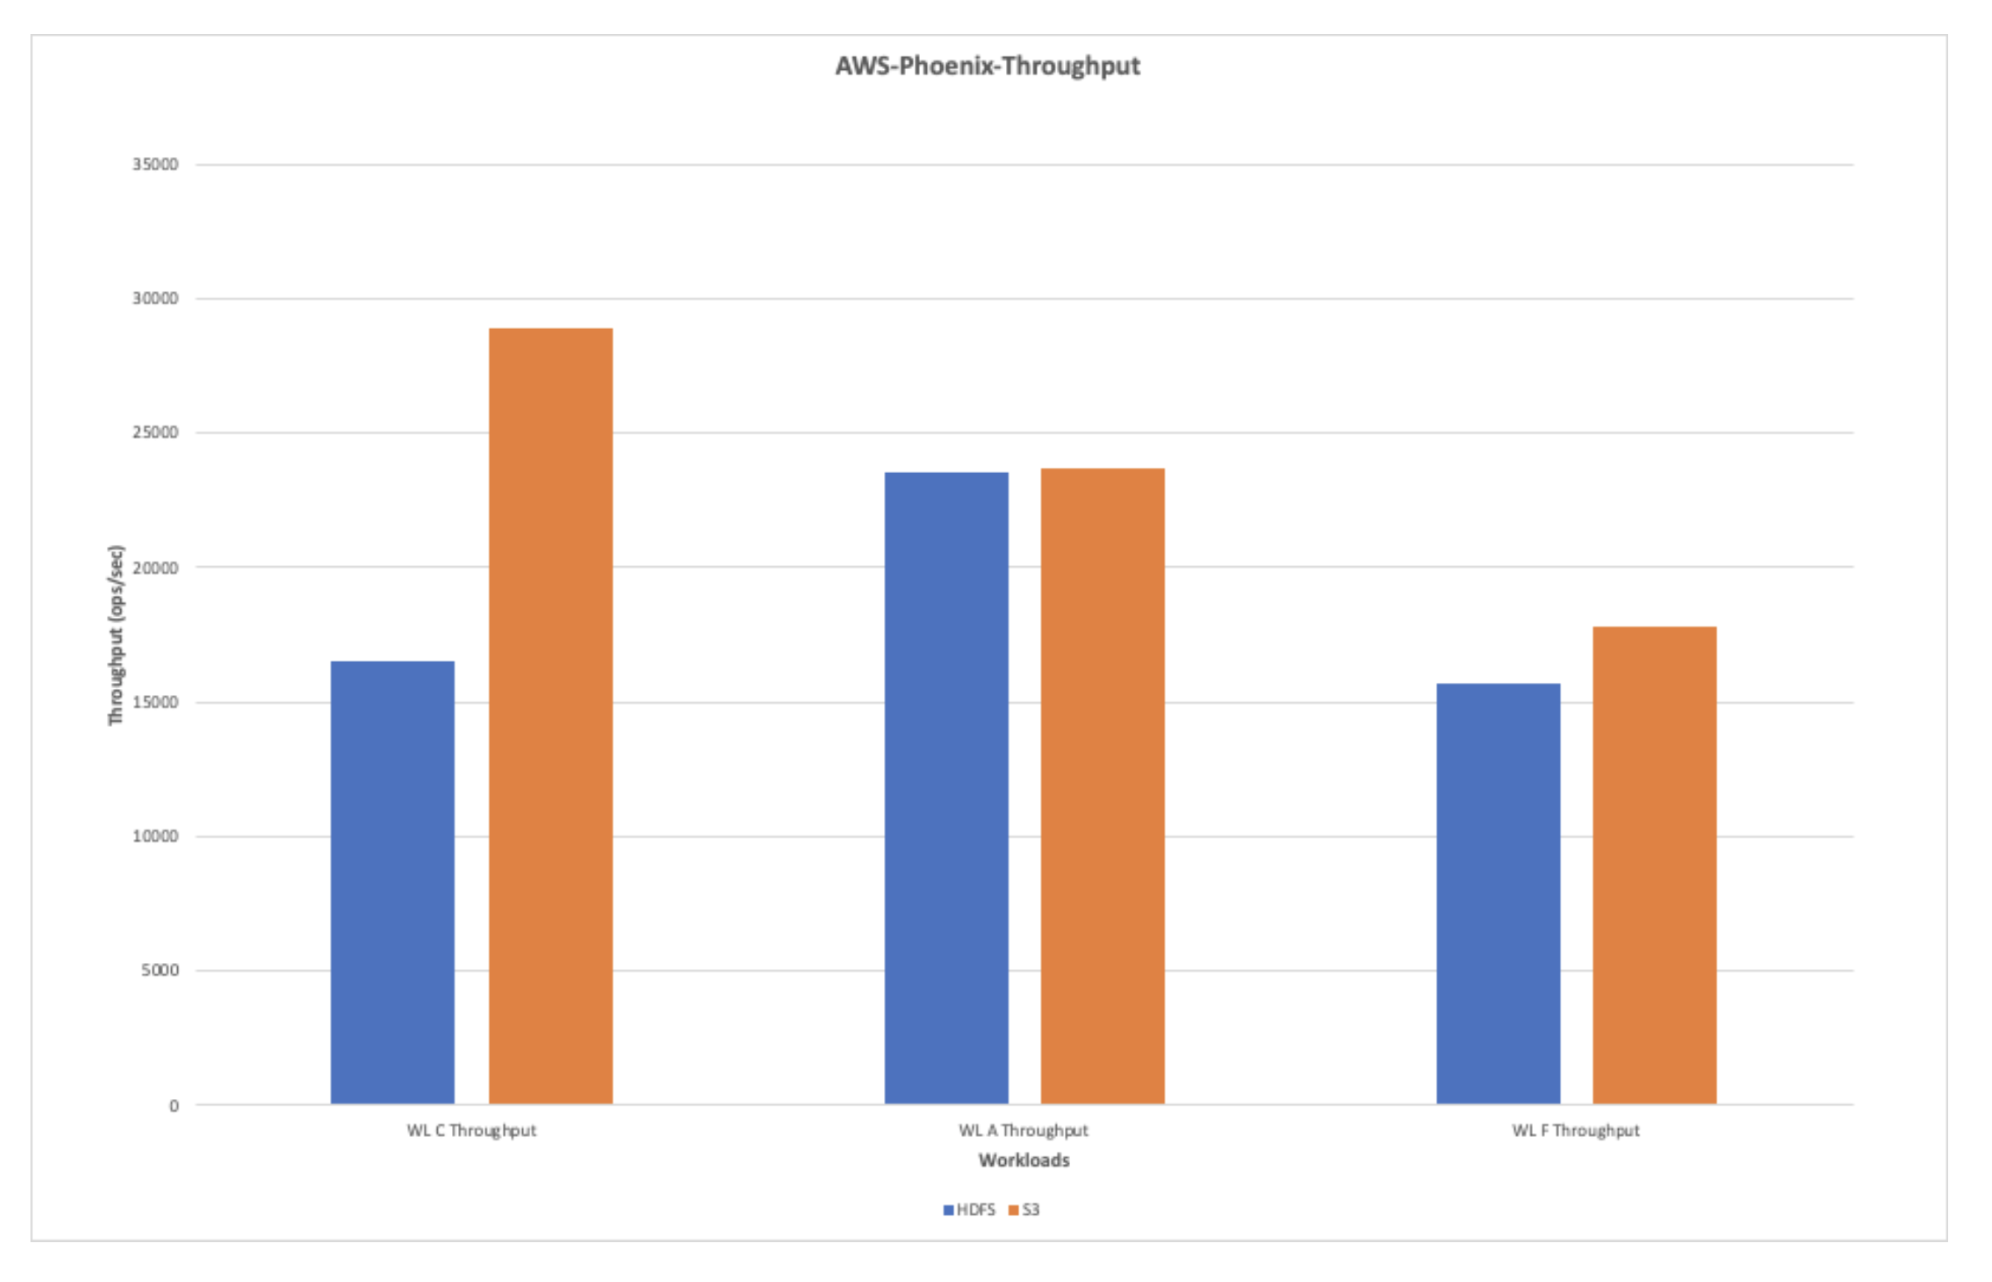
AWS-Phoenix-Throughput(ops/sec)
The chart below shows the average throughput when the workloads were run with Phoenix against HDFS and S3. The overall read throughput is found to be better than the write throughput during the tests.
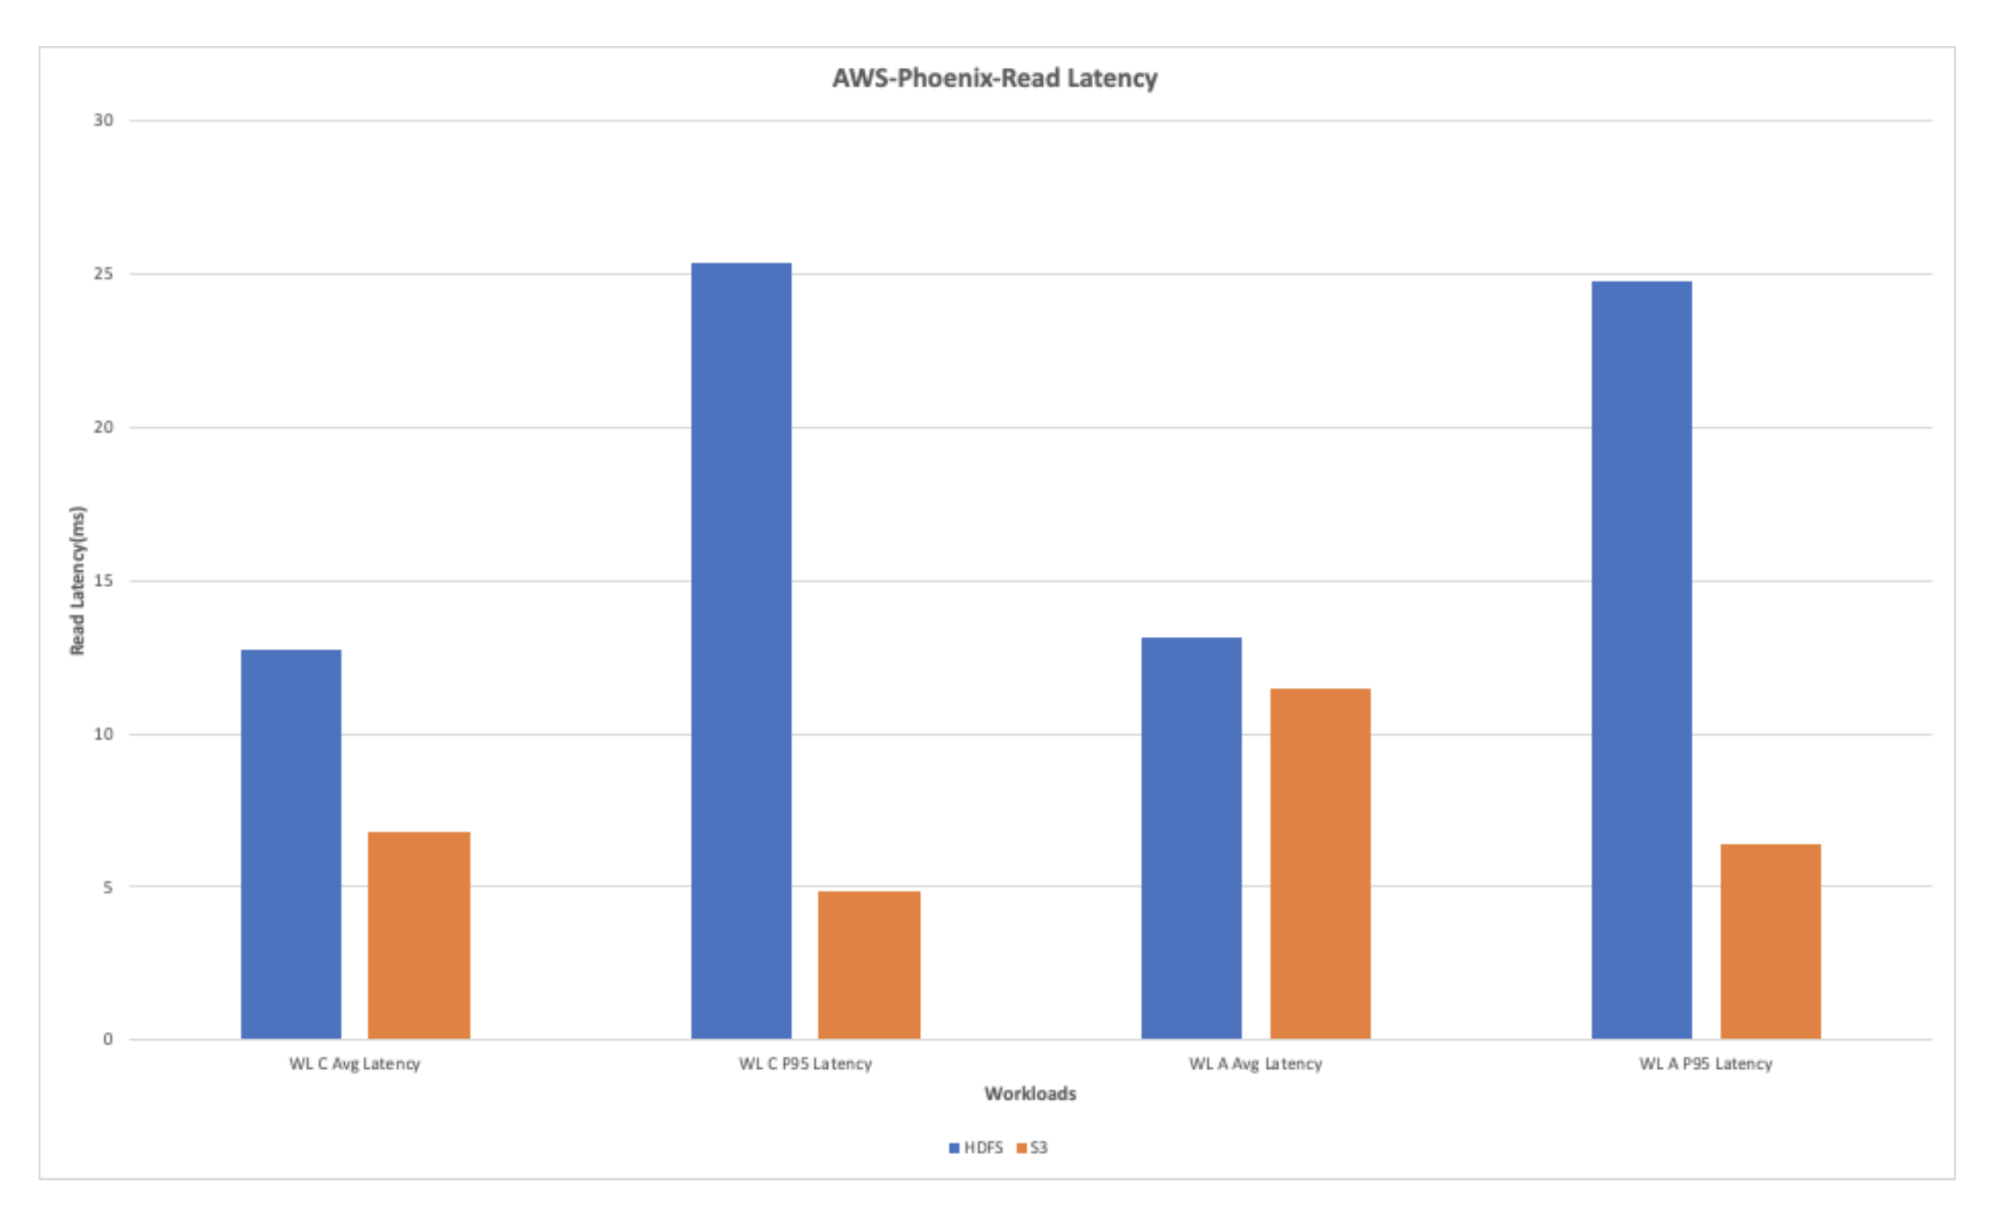
AWS-Phoenix Read Latency
The overall read latency for the read heavy workloads shows improvement when using S3. The chart below shows that the read latency observed with S3 is better by multifold when compared with the latency observed while running the workloads on HDFS.
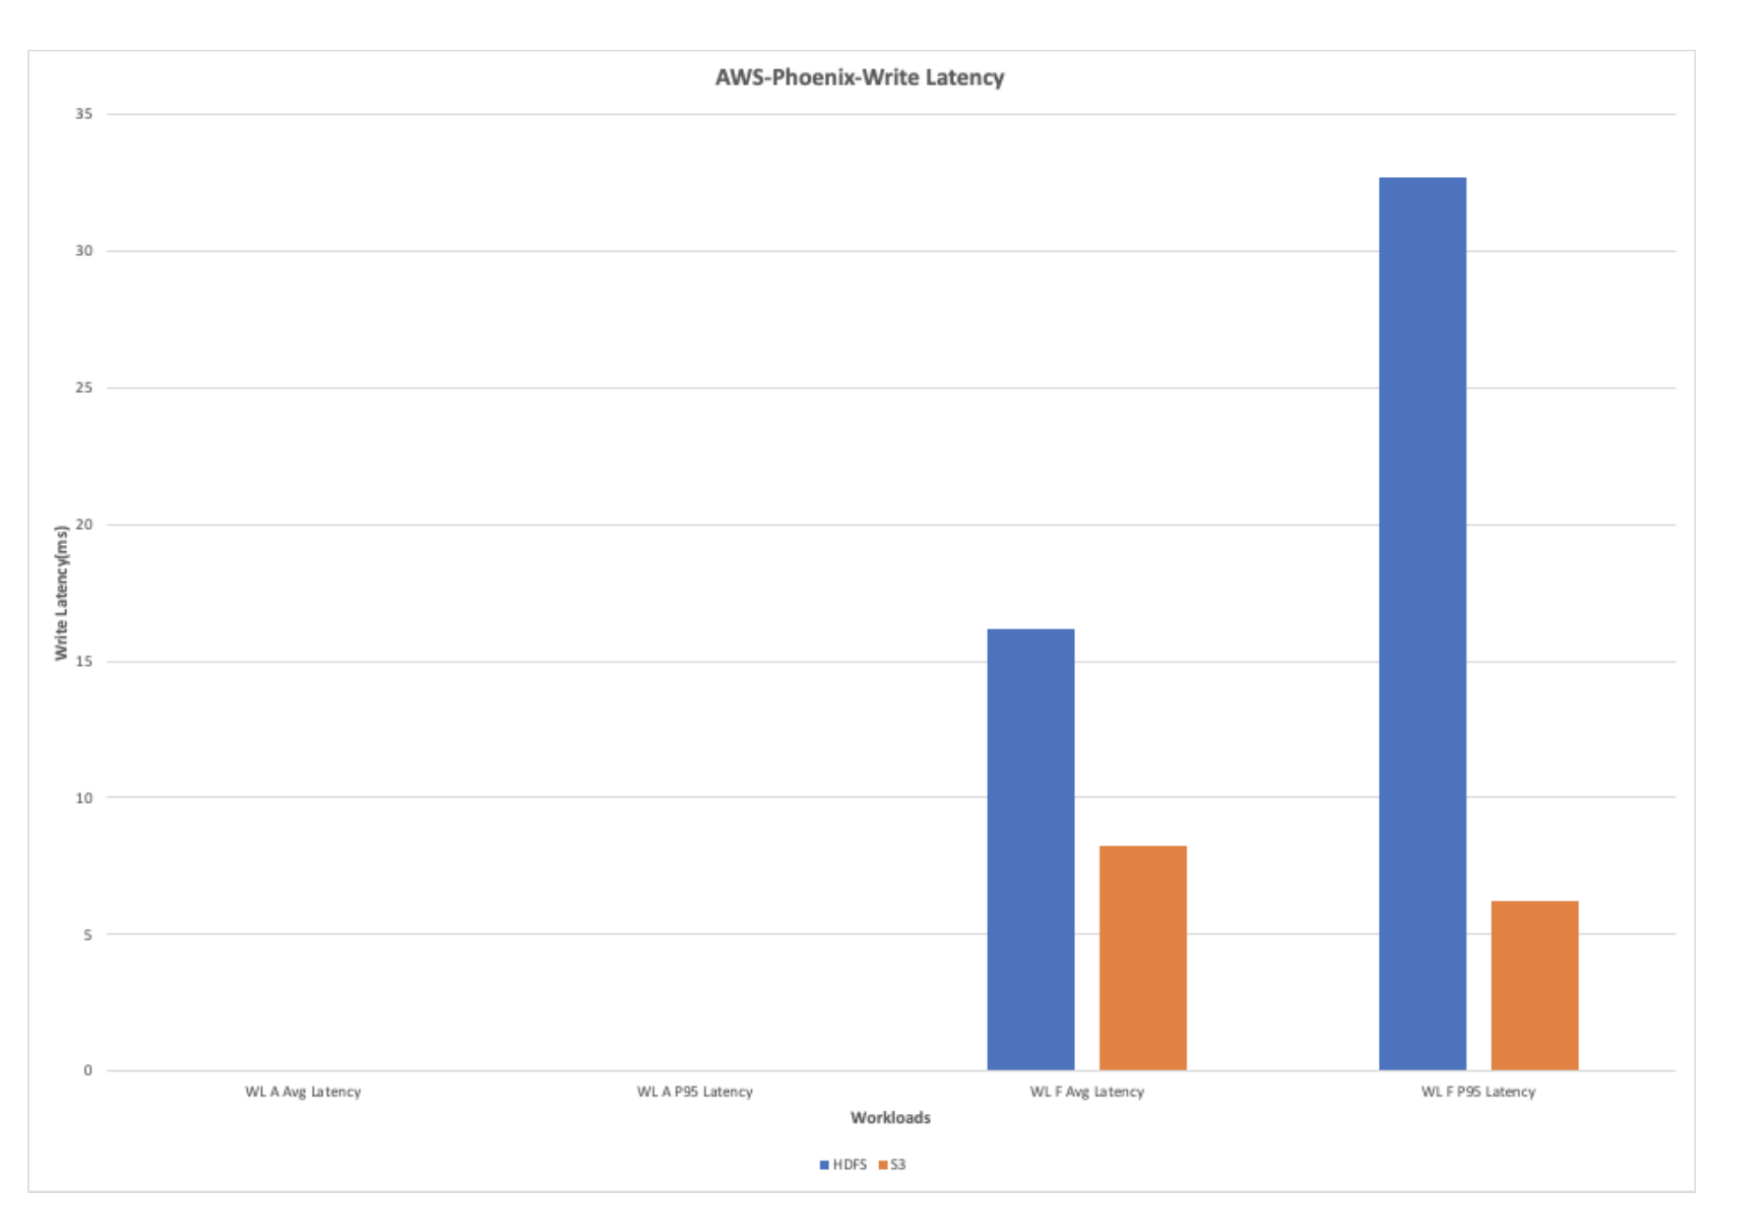
AWS-Phoenix-Write Latency
The write heavy workload shows tremendous improvement in the performance because of the reduced write latency in S3 when compared to HDFS.
Azure
The performance measurements were also conducted on HBase running on Azure ABFS storage and the results were compared with HBase running on HDFS. The following few charts show the comparison of key performance metrics when HBase is running on HDFS vs. HBase running on ABFS.
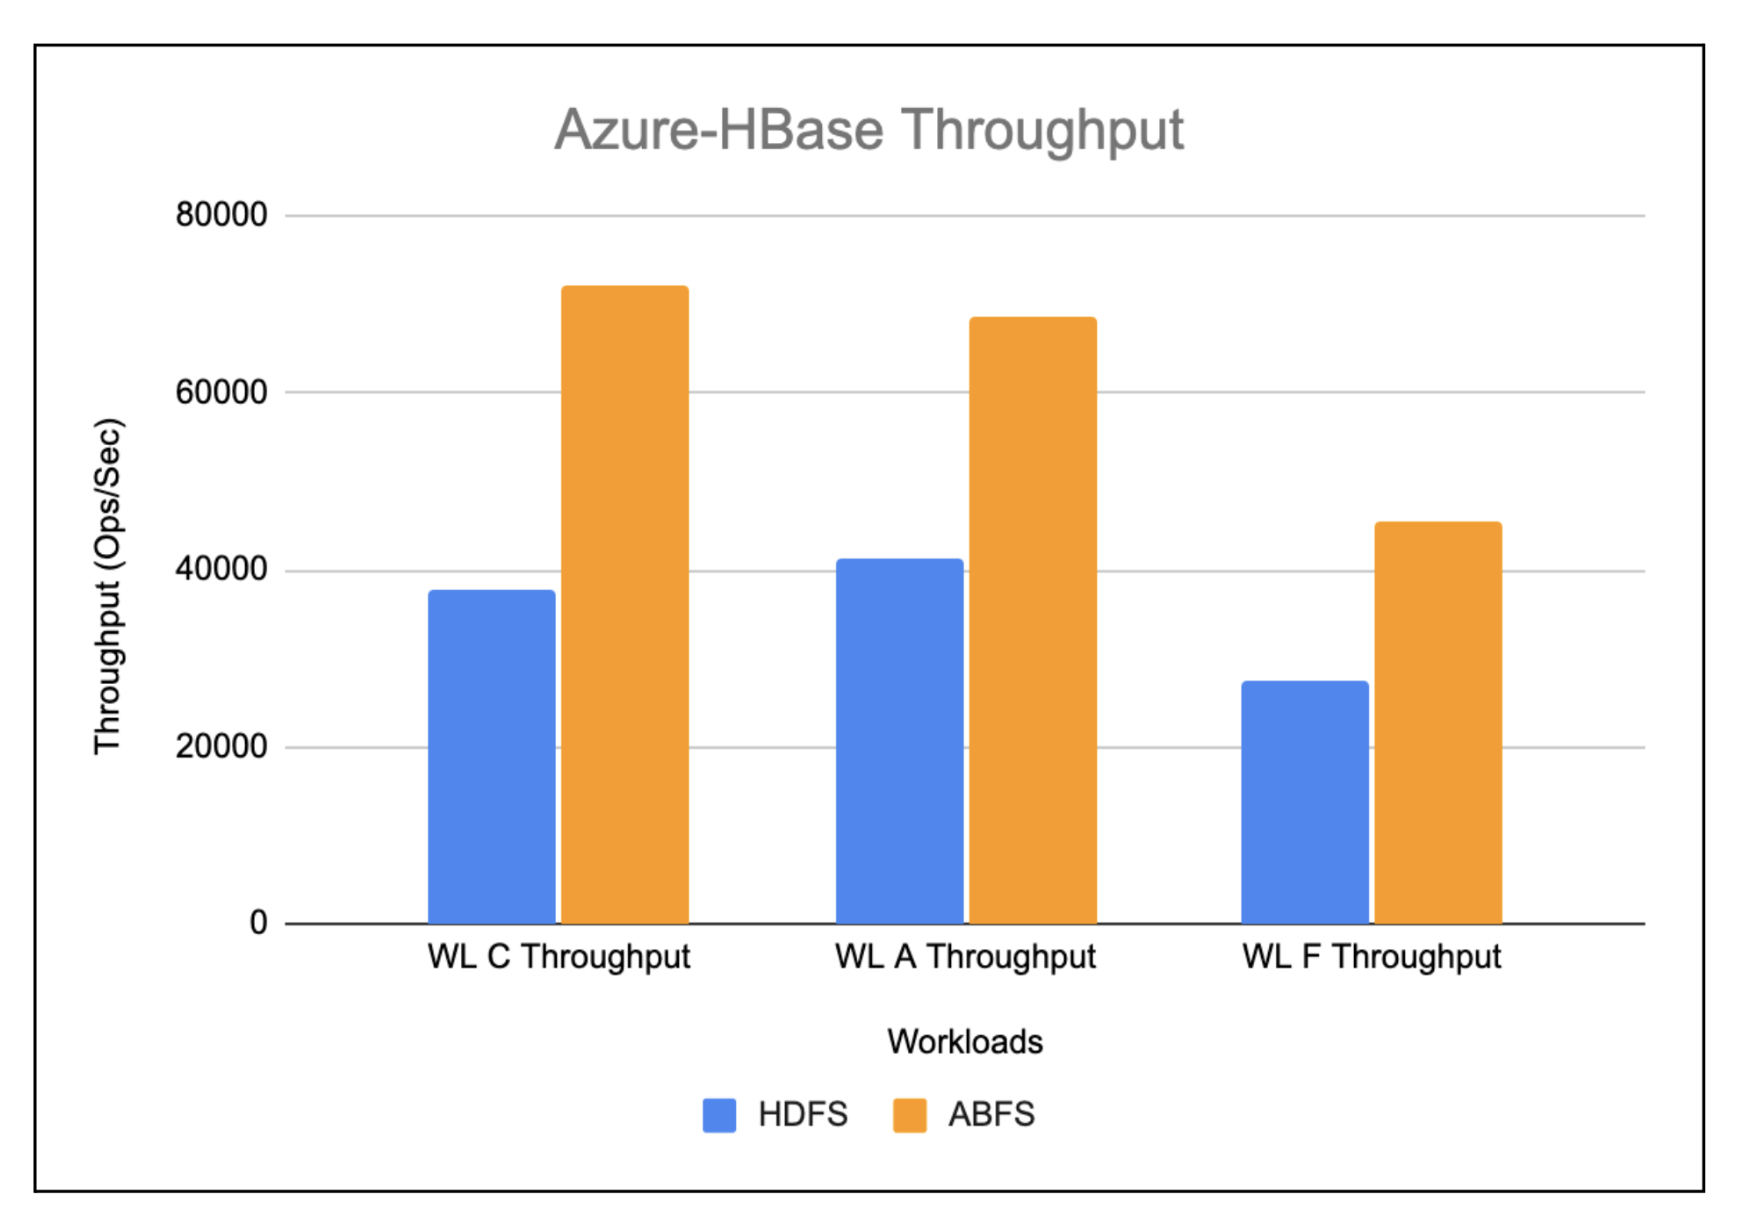
Azure-HBase-Throughput(ops/sec)
The workloads running on HBase ABFS show almost 2x improvement when compared to HBase running on HDFS as depicted in the chart below.
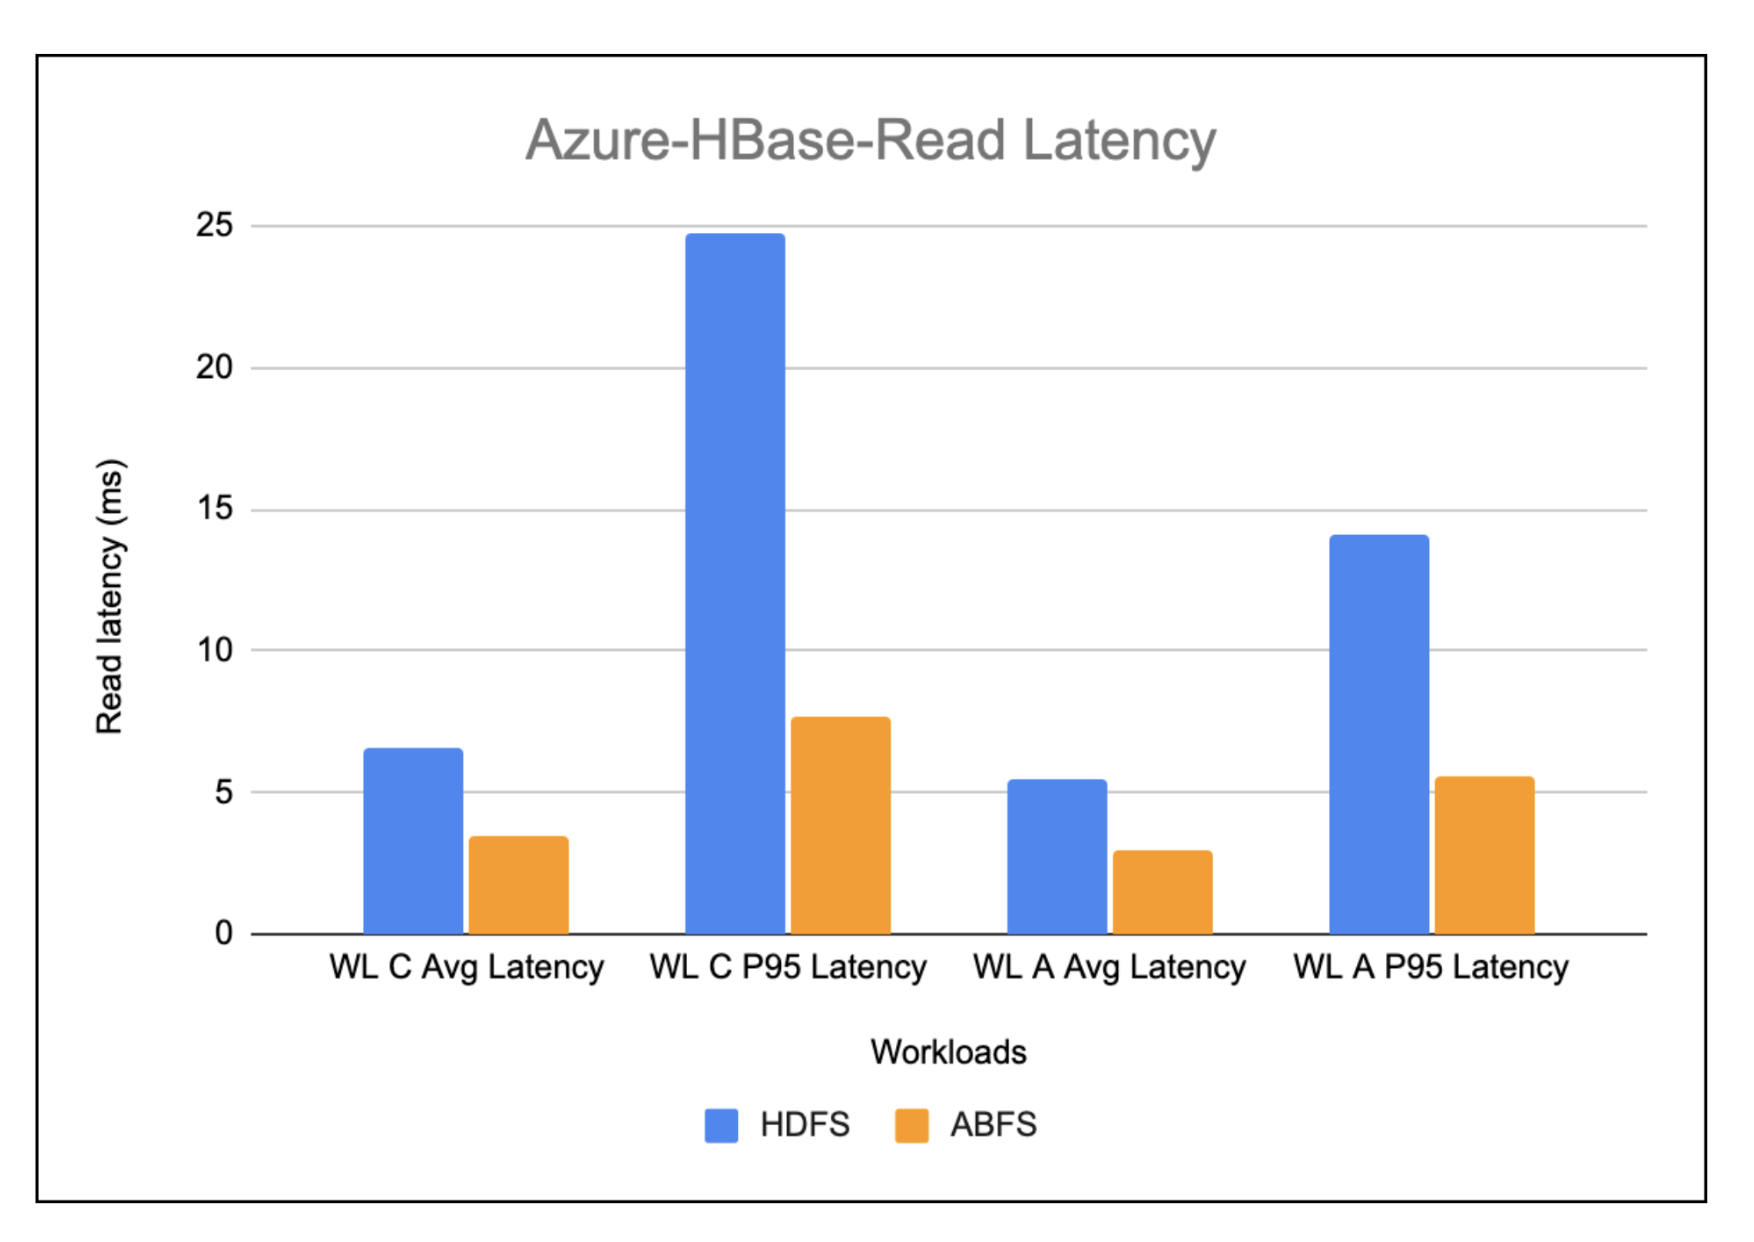
Azure-Hbase-Read Latency
The chart below shows the read latency observed while running the read heavy workloads on HBase running on HDFS vs. HBase running on ABFS. Overall, the read latency in HBase running on ABFS is found to be more than 2x better when compared to HBase running on HDFS.
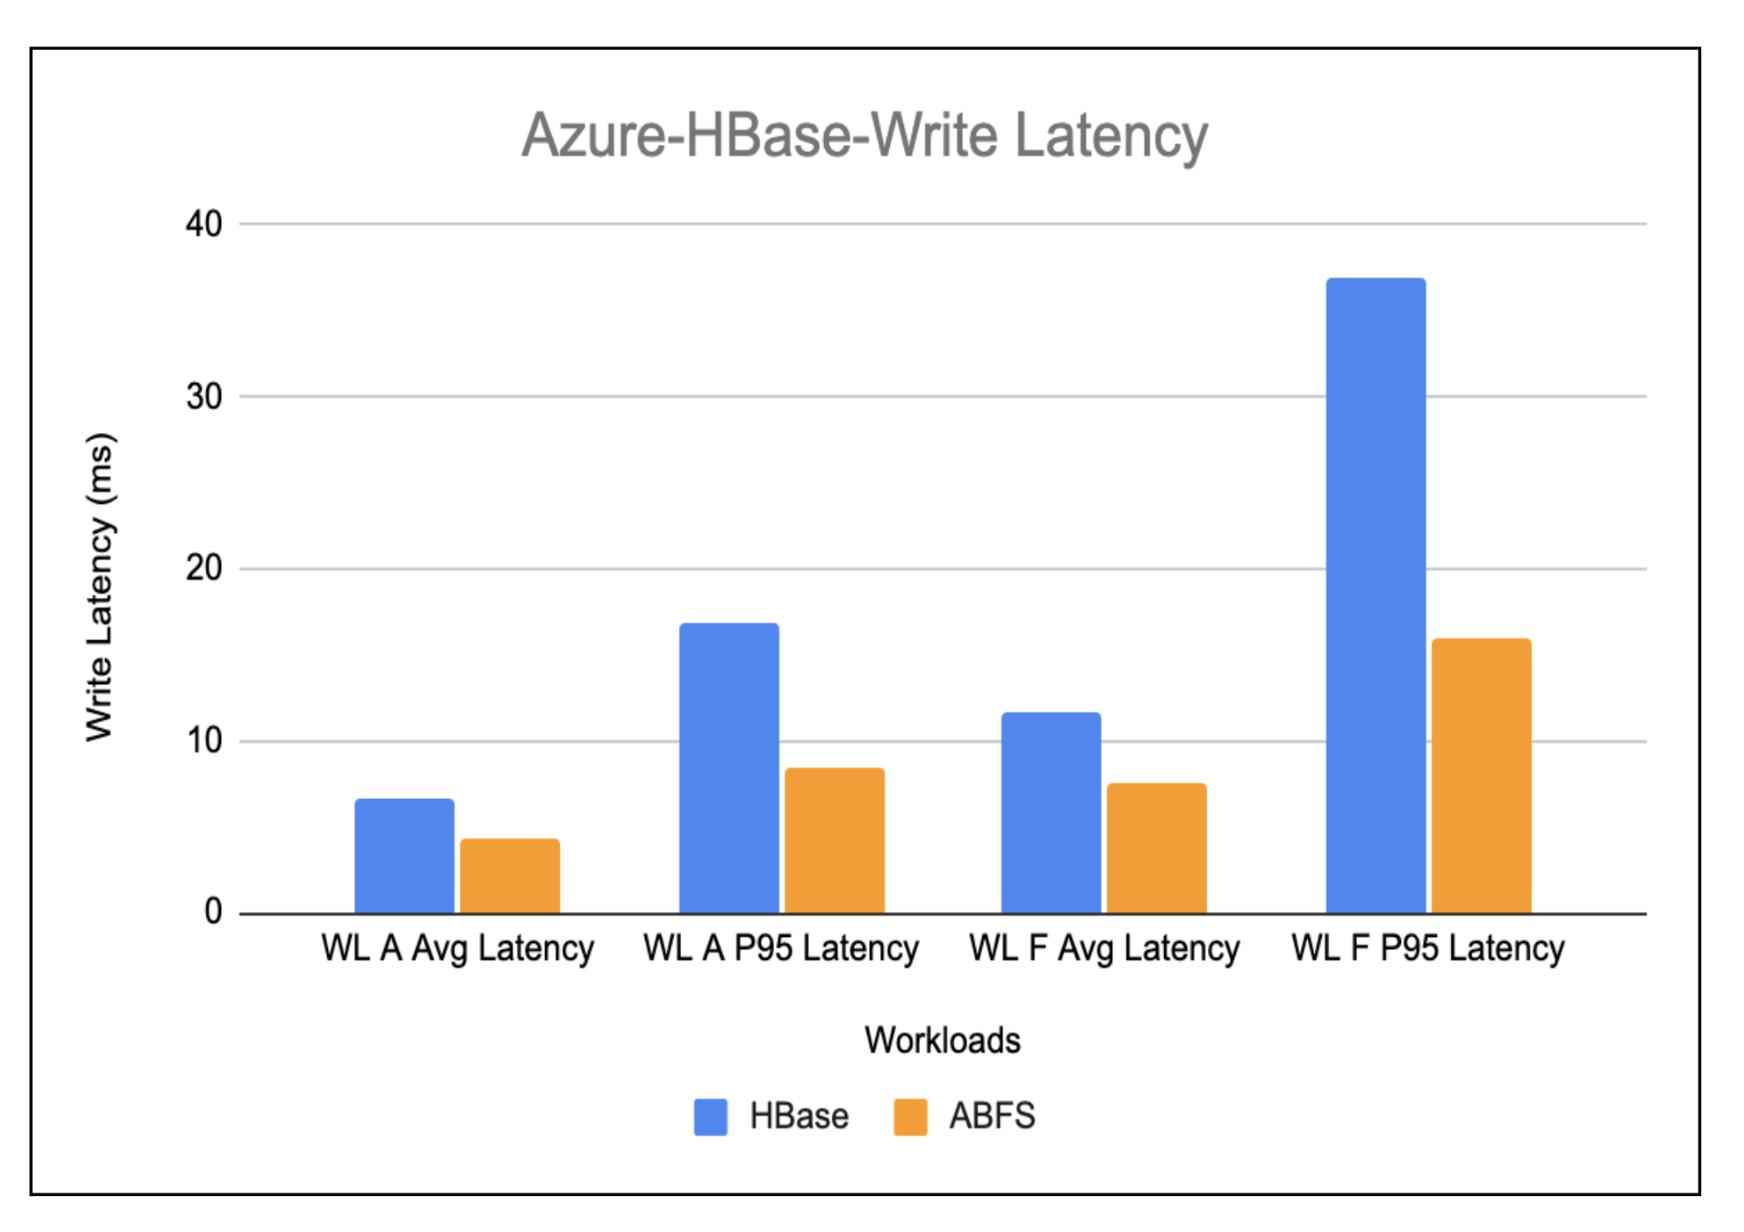
Azure-Hbase-Write Latency
The write-heavy workload results shown in the below chart show an improvement of almost 1.5x in the write latency in HBase running on ABFS as compared to HBase running on HDFS.
Things to consider when choosing the right COD deployment environment for you
- Cache warming while using cloud storage
- After the initial creation of the cluster, a warming-up process is initiated for the cache. This process entails fetching data from cloud storage to gradually populate the cache. Consequently, the cluster’s responsiveness to queries might experience a temporary slowdown during this period. This slowdown is primarily due to queries needing to access cloud storage for uncached blocks directly, all while contending with the cache population for CPU resources.
The duration of this warming-up phase typically falls within the range of three to five hours for a cluster configured with 1.5TB of cache per worker. This initial phase ensures optimized performance once the cache is fully populated and the cluster is running at its peak efficiency.
- AWS S3 throttling (AWS)
The inherent latency linked with such storage solutions is expected to cause slowness in retrieving data from cloud storage. And also, each access results in incurring a cost. However, the cloud storage’s built-in throttling mechanism stands as another significant factor that affects performance and resilience. This mechanism confines the number of allowed calls per second per prefix. Exceeding this limit results in unattended requests, with the potential consequence of halting cluster operations.
In this scenario, cache warming takes on a pivotal role in avoiding such situations. By proactively populating the cache with the data, the cluster can bypass a reliance on frequent and potentially throttled storage requests.
- Non-atomic operations
- Operations within cloud storage lack atomicity, as seen in cases like renames in S3. To address this limitation, HBase has implemented a store file tracking mechanism which minimizes the necessity for such operations in the critical path, effectively eliminating the dependency on these operations.
Conclusion
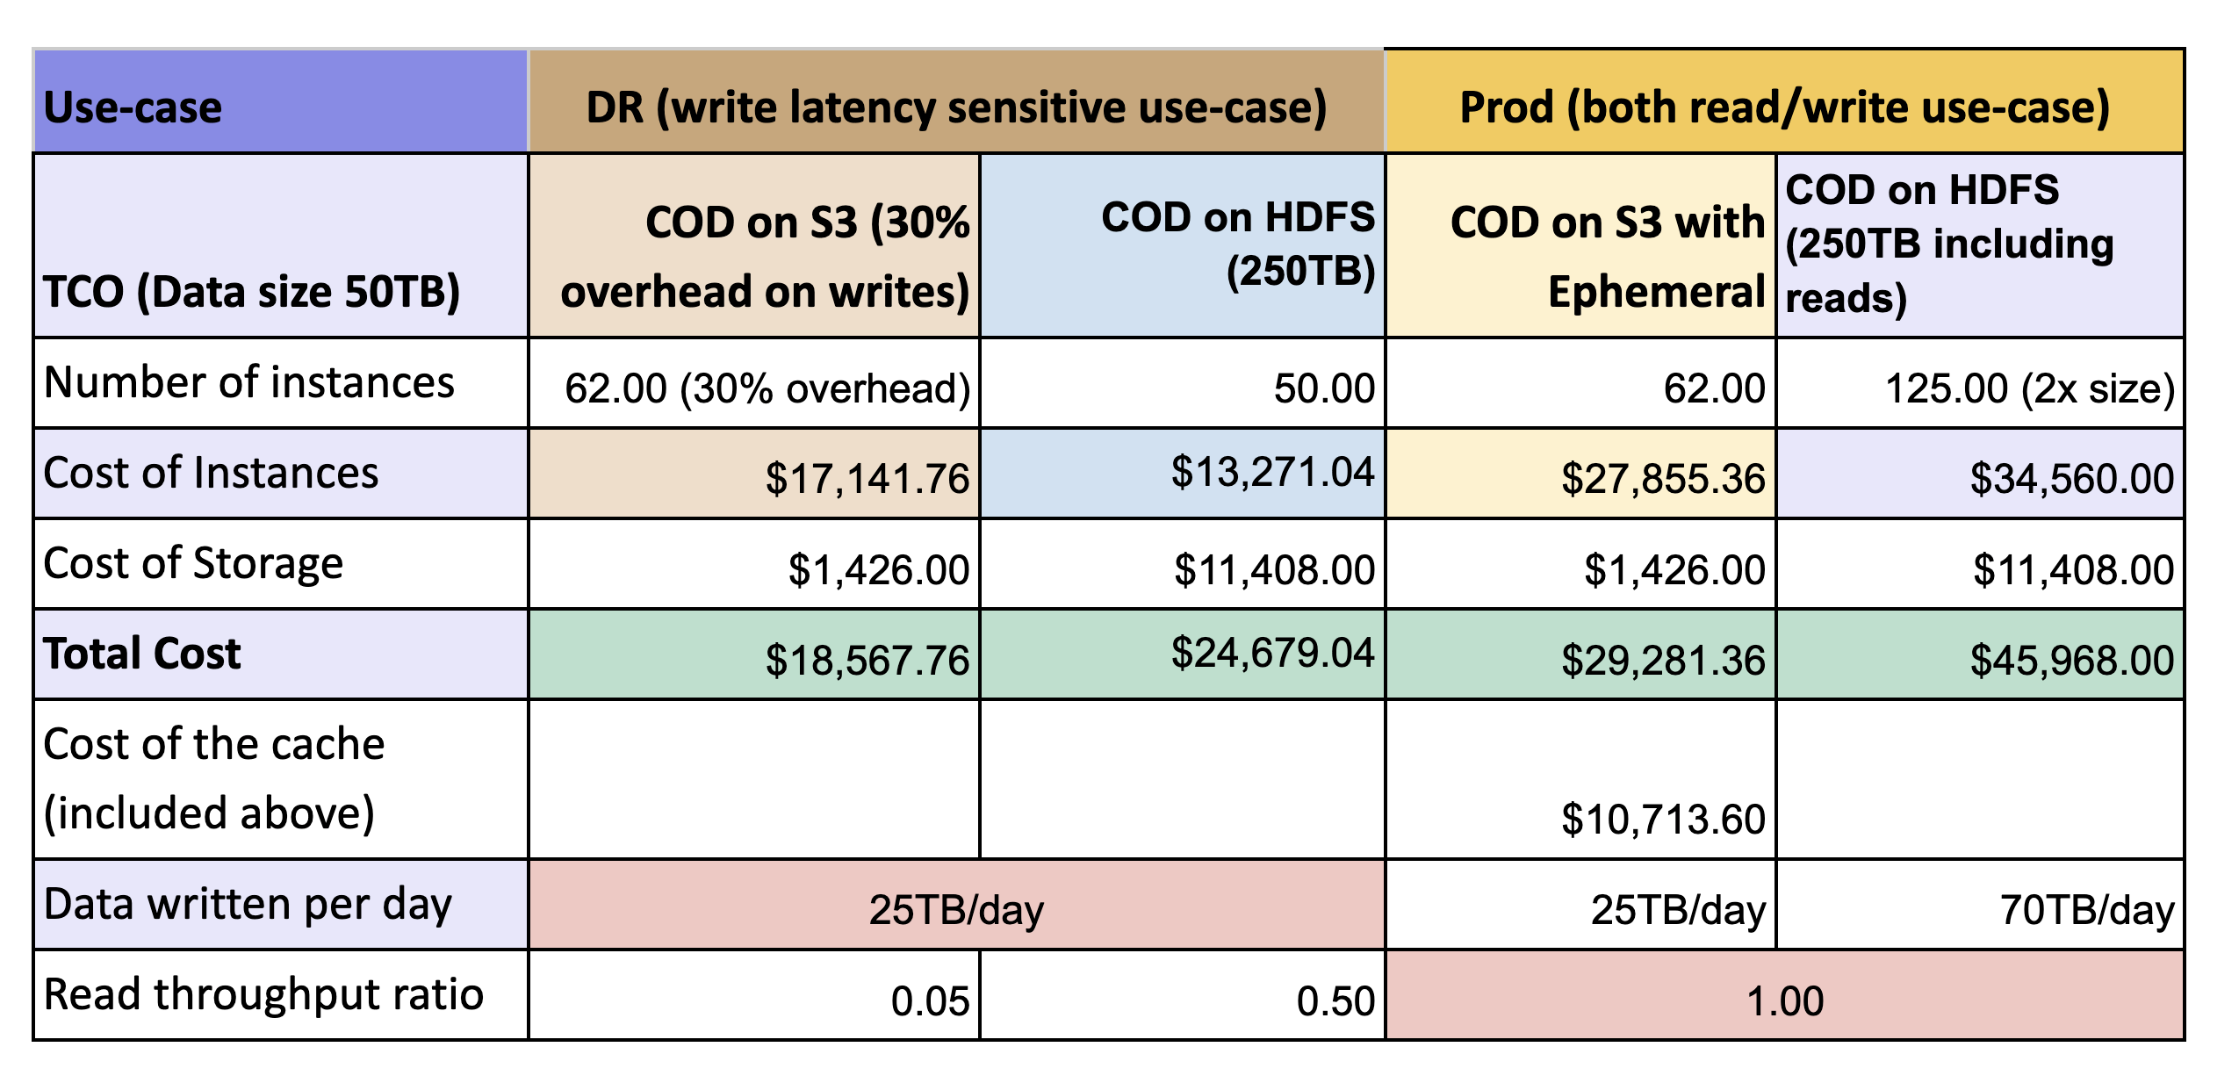
The table below shows the total cost of ownership (TCO) for a cluster running COD on S3 without ephemeral cache (DR scenario) and with ephemeral cache (production scenario) as compared with a cluster running COD on HDFS.
We observed that the overall throughput of HBase with cloud storages with bucket cache is better than HBase running on HDFS with HDD. Here’s some highlights:
- With cached warm-up, cloud storage with cache yields 2x better performance with low TCO as compared to HDFS. The performance with cloud storage is attributed to local cache based on SSD where HDFS using costlier EBS-HDD requires three times of storage to account for replication.
- Write performance is expected to be same as both form factors uses HDFS as the base for WAL but as we are flushing and caching the data at the same time there is some 30% impact was seen
DR Cluster: This cluster is dedicated to disaster recovery efforts and typically handles write operations from less critical applications. Leveraging cloud storage without local storage to support cache, users can expect to achieve approximately 25% cost savings compared to an HDFS-based cluster.
Prod Cluster: Serving as the primary cluster, this environment functions as the definitive source of truth for all read and write activities generated by applications. By utilizing cloud storage solution with local storage to support cache, users can realize a substantial 40% reduction in costs
Visit the product page to learn more about Cloudera Operational Database or reach out to your account team.
Editor's Choice

