In mid-2017, we were working with one of the world’s largest healthcare companies to put a new data application into production. The customer had grown through acquisition and in order to maintain compliance with the FDA, they needed to aggregate data in real-time from dozens of different divisions of the company. The consumers of this application, of course, did not care how we built the data pipeline. However, they cared greatly that if it broke, and the end-users did not get their data, they would be out of compliance and could be subject to massive fines.
The data pipeline was built primarily on the Cloudera platform using Apache Spark Streaming, Apache Kudu, and Apache Impala; however, there were components that relied upon automation built in Bash and Python as well. Having supported data products in the past, we knew that data applications need robust support, beyond strong up-front architecture and development. Specifically, we needed to ensure that errors would not go unnoticed. If any part of our pipeline were to have issues, we needed the ability to act proactively. We set up Cloudera Manager to issue alerts for the platform, but the tricky question was how could we be alerted if any part of the application pipeline would fail—inside or outside the Cloudera platform?
Our Options
There are of course many log aggregation and alerting tools on the market. Out of the box, Elasticsearch provides overall the same log searching functionality as Apache Solr. In our case, though, managing an Elasticsearch cluster would be extra work, and our customers were already using Cloudera Search (i.e. Solr integrated with CDH) elsewhere. Creating an additional cluster was just not worth the extra overhead and cost. Other solutions we looked at were prohibitively expensive. For example, one of the options we evaluated was priced based on the volume of data ingested and aggregated. Having been down this road in the past, we knew that you end up spending a lot of time adjusting log verbosity and making sure only important things are logged. This is low-value work, and storage is (or should be!) cheap.
Given that the application had PHI and HIPAA data, we also wanted a solution that included role-based access control (RBAC). The Apache Sentry integration with Solr that Cloudera provides, enables role-based access control, meaning our customer would be able to use their existing Sentry roles to also protect their log data against unauthorized access using their existing processes.
In short, Cloudera Search (the out of the box pre-integrated Solr with CDH) seemed as the best option that would already fit in, and save on multi-solution complexity.
Pulse
After having chosen Cloudera Search for storing logs, we needed to build some functionality that would satisfy the clients needs:
- The ability to search and drill down into logs, following line and speed of thought, to find issues quickly. Searching aggregated logs in a centralized location cut their debugging time dramatically.
- Create flexible alerts reacting to your log data as it arrives, in real time.
- Secure logs against unauthorized access. This was especially important since applications included PHI and HIPAA data.
- Keep their logs for a configurable amount of time.
To satisfy these requirements we created Pulse, a log aggregation and alerting framework. Pulse stores logs in Solr, which gives full text search over all log data. Sentry, as mentioned above, would handle role-based access control and works with Solr, so it’s easy to control access to private data. Pulse itself adds functionality like log lifecycle management so logs are kept only as long as needed. It includes log appenders for multiple languages that make it easy to index and search logs in a central location. Pulse also has a built-in alerting, so alerts will trigger, in real time, when things go wrong.

Pulse runs on your existing infrastructure and is not a cloud based service. Pulse is packaged into a Cloudera Custom Service Descriptor (CSD), which means it is easily installed via Cloudera Manager. In addition to making the install of Pulse painless on your Cloudera Hadoop cluster, Cloudera Manager acts as a supervising process for the Pulse application, providing access to process logging and monitoring.
Pulse consists of four components:
- Log Appenders: a log4j appender is pre-packaged with Pulse, other appenders for Python and Bash are also available.
- Log Collector: an http server that listens for log messages from the appenders and puts them into the Apache Solr (Cloud) full text search engine. The Log Collector can be scaled across your cluster to handle large volumes of logs.
- Alert Engine: service runs against near-real-time log data indexed in to Solr Cloud. Alerts run on an interval and can alert via email or http hook.
- Collection Roller: handles application log lifecycle and plumbing. Users configure how often to create a new index for logs and how long to keep logs.
Each log record stored in Pulse contains the original log message timestamp, making it easy to create time-series visualizations of log data.
Below we will now describe some key aspects of Pulse that we used to build our solution.
Log Appenders
Since our client’s applications were written in multiple languages, we created log appenders that could be plugged into existing applications easily. Pulse has log collectors for Java (using log4j), Python, and Bash. The appenders write to the Log Collector, which decouples the applications from the log storage layer.
Log Collector

We didn’t want each application managing its own connection to Solr, so we created The Log Collector which would list for log events, handle authentication and authorization, batch them, and write them to Solr. Because the Log Collector is just a REST API, it’s easy to configure applications in any language to use it. The Log Collector also decouples the applications from the storage, giving us flexibility in the future to write different types of appenders, or consume existing logs with tools like Logstash or Fluentd.
Collection Roller
Another thing we didn’t want to have to manage manually is the lifecycle of application logs, so we created the Collection Roller to automatically cycle through/delete collections after they reach a pre-configured age.
The image below describes how the Collection Roller works with collection aliases. The write alias (suffixed with _latest internally in Pulse) points at the most recently created collection. It’s used by the Log Collector so it doesn’t have to know about specific collections. The read alias (suffixed with _all internally in Pulse) will always point at all log collections for a single application. It is used by visualization or search tools wanting to access all log data.
Every day, a new collection is created, while the oldest collection is deleted. The image below describes this process.

Alerts Engine and Visualization
The Alert Engine was created to continually monitor the incoming logs from the client applications so we could quickly react if something went wrong. The alert engine used standard Lucene query syntax, so we could be as flexible as possible with the type of alerts we wanted to create.
For example, this query will alert on any error message in the last 10 minutes:
timestamp:[NOW-10MINUTES TO NOW] AND level: ERROR
And this one alerts if a metric goes out of the range of 50-100:
timestamp:[NOW-10MINUTES TO NOW] AND metric:[101 TO *] OR metric: [0 TO 49]
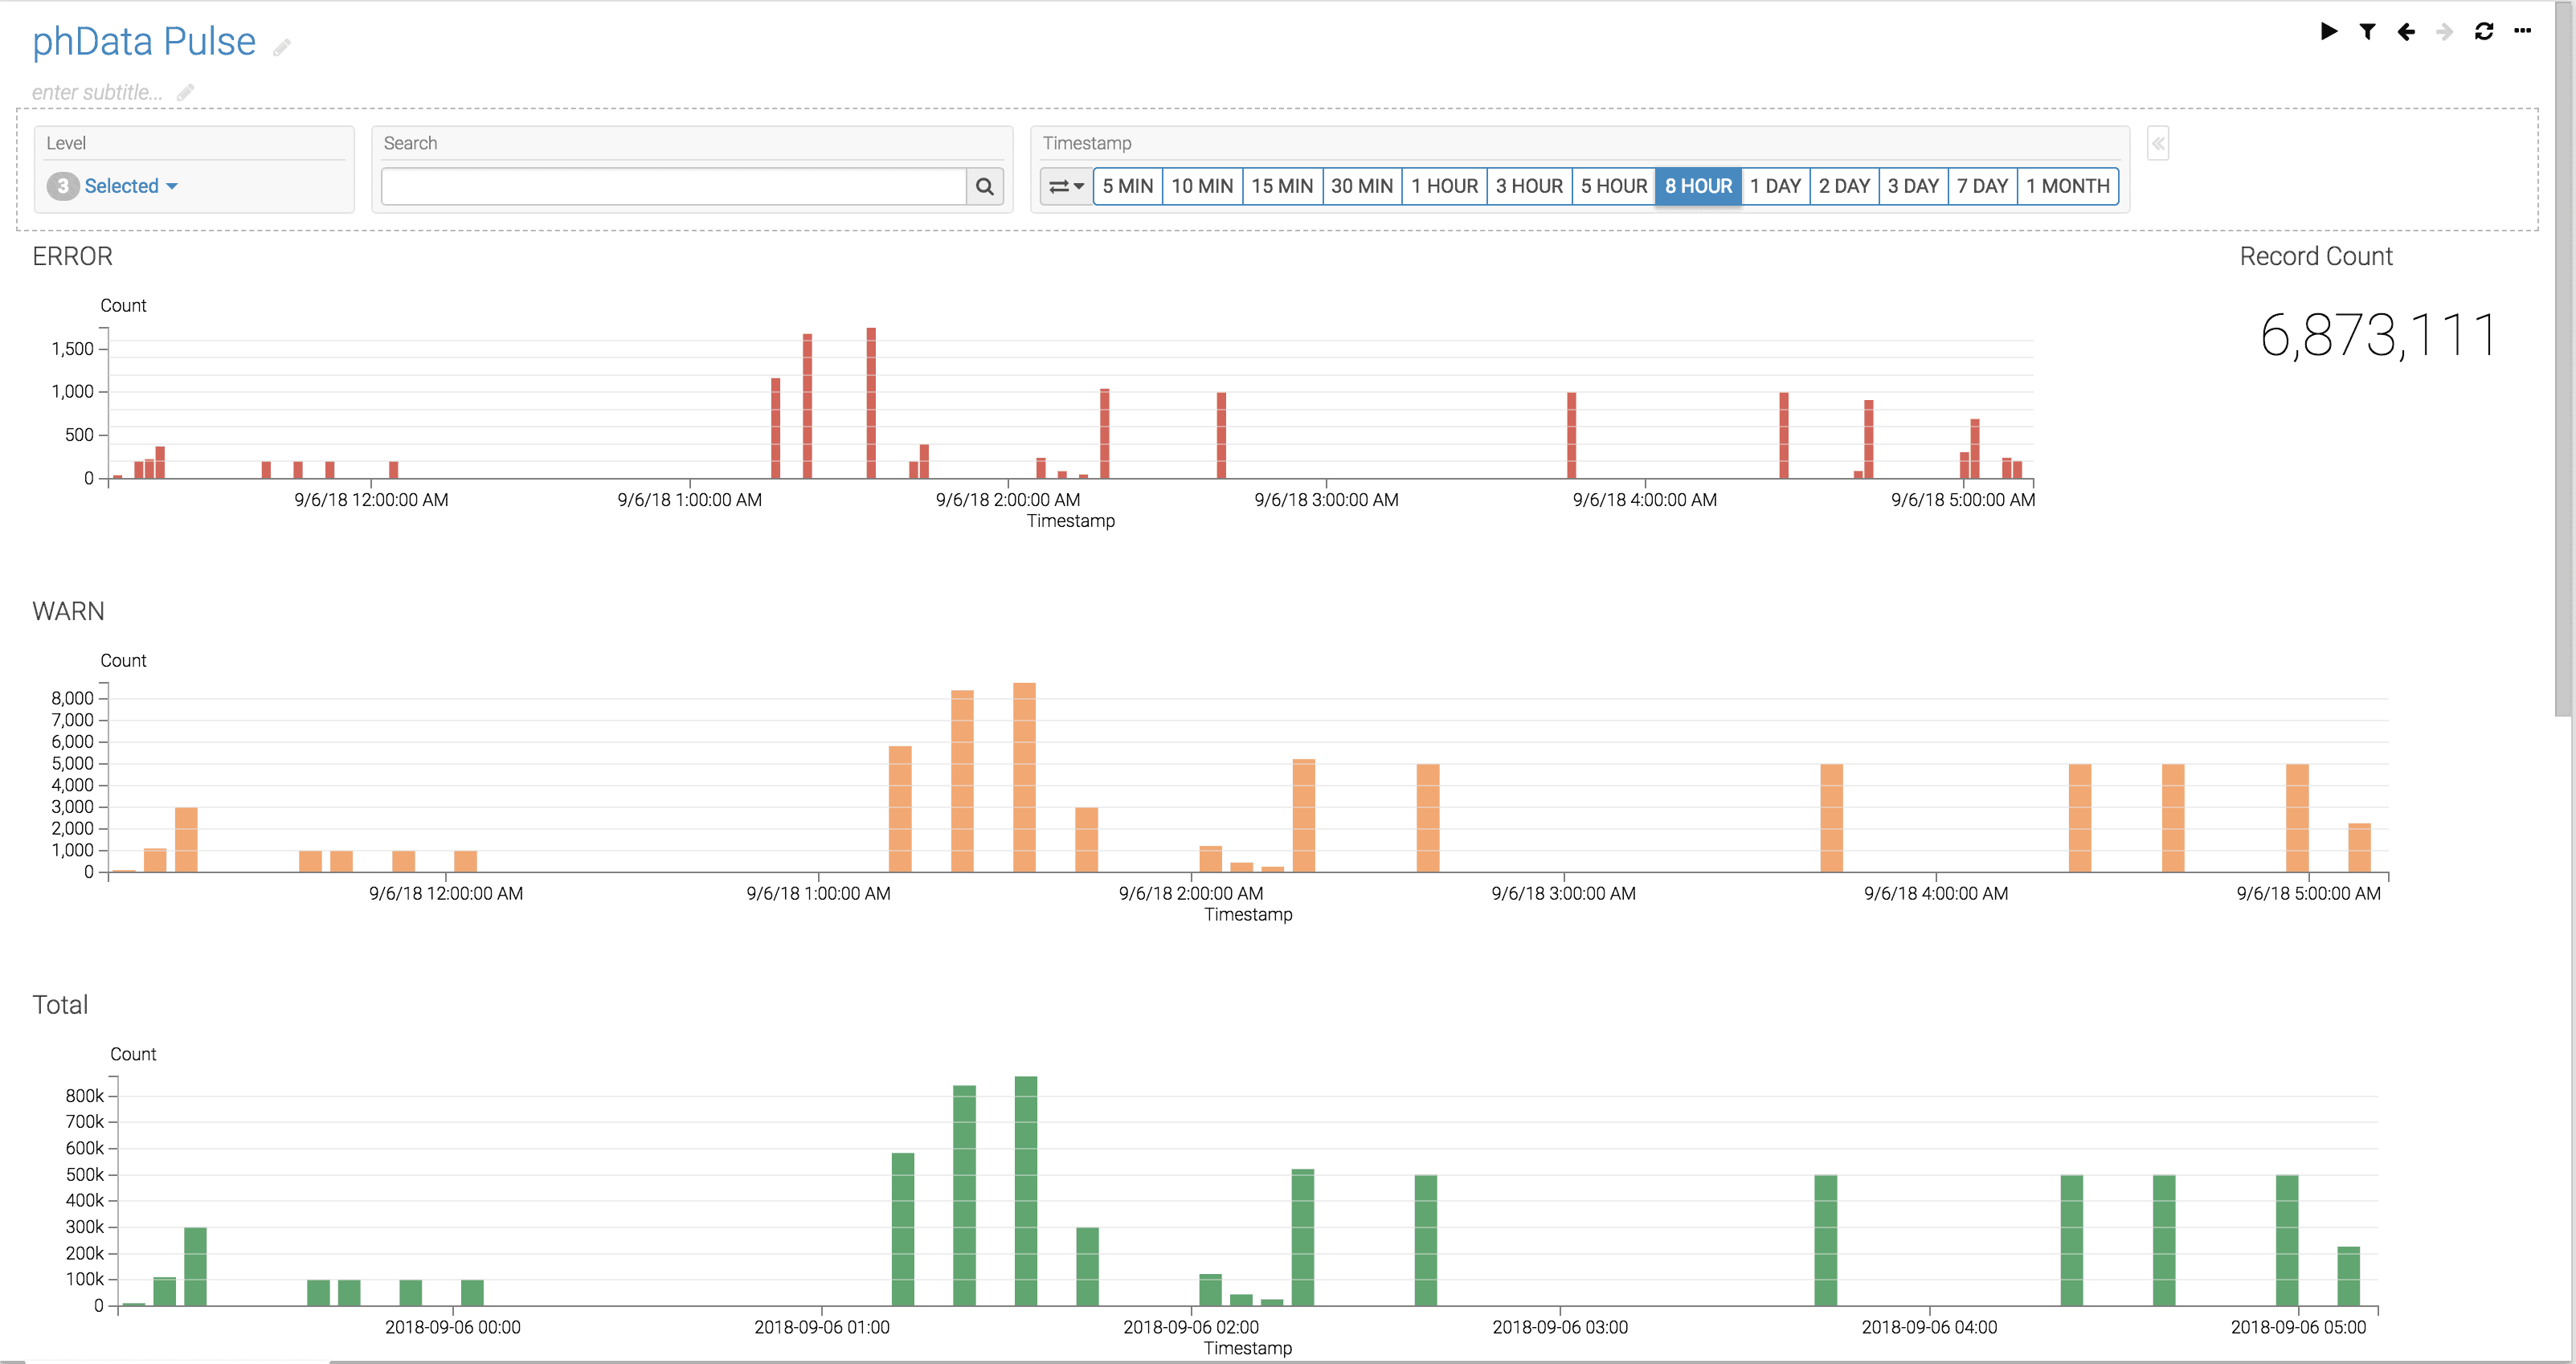
In order to add visualization to the logs so our customers could see trends and drill into errors, we created a dashboard for each application.
Here is a screenshot of a dashboard using Arcadia Data:
Conclusion
We created Pulse to handle log collection, lifecycle, and alerting on top of Cloudera Search. Cloudera Search is an excellent and powerful built-in search solution for log analytics if you are already deployed with CDH. It reduces IT complexity as you do not need to integrate security (Sentry is already integrated) and handle multiple vendor stacks and deployments.
Pulse lets you keep control of your logs and while taking advantage of your existing infrastructure and tools. Pulse is Apache 2.0 licensed. If you want to learn more visit https://github.com/phdata/pulse.
Tony Foerster is a Staff Engineer at phData. phData is a Cloudera strategic partner and provides deployment and managed services for Big Data applications on Cloudera.


