In today’s data-driven world, businesses rely heavily on their dashboards to make informed decisions. However, traditional dashboards often lack the intuitive interface needed to truly harness the power of data. But what if you could simply talk to your data and get instant insights?
In the latest version of Cloudera Data Visualization, we’re introducing a new AI visual that helps users leverage the power of Large Language Models (LLMs) to “talk” to their data. Cloudera Data Visualization now leverages the latest advancements in natural language processing to transform your business dashboards into intelligent platforms.
Gone are the days of tedious filtering schemes and dropdown menus. With Cloudera Data Visualization, users can now have interactive conversations with their data, thanks to its seamless integration with LLMs of their choosing.. This means users can ask questions in plain language and receive accurate, contextually relevant responses. Say goodbye to static dashboards and hello to a whole new level of engagement.
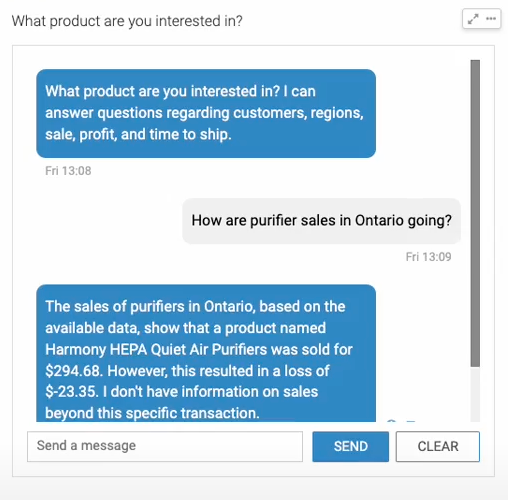
One of the most remarkable features of the AI visual is its ability to understand context. For example, if a user asks their office supply data sets about “binders,” Cloudera Data Visualization automatically recognizes that the query might be referring to both durable and economy types that are sold by your organization. This level of intelligence streamlines the analysis process and saves valuable time. In the example below, the assistant is answering a question about sales performance of a particular product in a particular region.

AI Visual in Cloudera Data Visualization
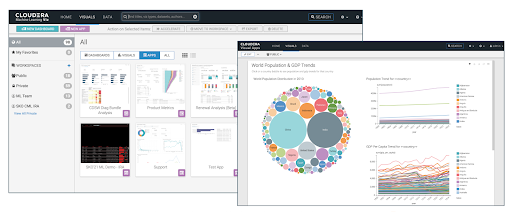
And don’t worry about losing track of the data behind the insights. Cloudera Data Visualization allows users to easily delve deeper into the underlying data, providing transparency and fostering trust in the results. This means users can build powerful visual dashboards and reports, and also have an additional layer of contextual intelligence through the AI visual for a comprehensive business intelligence workflow. So, whether you’re a data scientist, business analyst, or executive, Cloudera Data Visualization revolutionizes the way you interact with data. It empowers users to make faster, more informed decisions by putting the power of natural language processing at their fingertips.

Dashboards, Visuals and Apps in Cloudera Data Visualization
Ready to experience the future of business intelligence? Cloudera customers can now access the Technical Preview of this new AI visual within any Data Visualization dashboard or application, and see firsthand how LLMs can transform dashboards to make it easier to surface insights. For more information on these features and our AI capabilities, visit our Enterprise AI page. When you’re ready, you can request a demo at the bottom of the page to see how these capabilities can work in the context of your business. The future of data insight from visualization is here – and it’s smarter than ever before.


