Editor’s Note, August 2020: CDP Data Center is now called CDP Private Cloud Base. You can learn more about it here.
This article gives you an overview of Cloudera’s Operational Database (OpDB) performance optimization techniques. Cloudera’s Operational Database can support high-speed transactions of up to 185K/second per table and a high of 440K/second per table. On average, the recorded transaction speed is about 100K-300K/second per node.
This article provides you an overview of how you can optimize your OpDB deployment in either Cloudera Data Platform (CDP) Public Cloud or Data Center. The values and parameters that are provided here are suggestions based on typical deployment, and you may have to configure these parameters to suit your requirements.
Query optimization
A query optimizer determined the most efficient way to run a query. Query optimization helps you to reduce the hardware resources required to run a query and also speeds up your query-response time. Cloudera’s Operational Database provides you with various tools such as plan analyzers to make optimal use of your computing resources.
Cloudera’s OpDB provides various cost-based and rules-based optimizers. You can use different optimizers based on your use cases. OpDB is primarily used for Online Transactional Processing (OLTP) use cases with Apache Phoenix in the OpDB used as a SQL engine. But you can also use Hive and Impala for Online Analytical Processing (OLAP) use cases.
OLTP use cases
You can use Apache Phoenix as the SQL engine when you have OLTP use cases. Apache Phoenix provides a plan analyzer and prebinding tool using the EXPLAIN command that we discuss later in this blog post.
When using Apache Phoenix as a SQL engine, you can check out the cost statistics using the UPDATE STATISTICS command to view the statistics collected on a table. This command collects a set of keys per region per column family that are equal byte distanced from each other. These collected keys are called guideposts and they act as hints/guides to improve the parallelization of queries on a given target region.
All commands including Apache Phoenix UPDATE STATISTICS are scriptable and thus can be plugged into your chosen schedule. However, the UPDATE STATISTICS is automatically run during major compactions and region splits so manually running (or scheduling) this command is not required. The throttle quota feature, also known as RPC limit quota, is commonly used to manage length of RPC queue as well as network bandwidth utilization. It is best used to prioritize time-sensitive applications to ensure latency SLAs are met.
OLAP use cases
You can use Apache Hive or Apache Impala to query data for OLAP use cases. You can access the existing Apache HBase table through Hive using the CREATE EXTERNAL TABLE in Hive. You can use different types of column mapping to map the HBase columns to Hive. For more information, see Using Hive to access an existing HBase table example.
In the rest of the blog post. We will look specifically at how Cloudera’s Operational database helps you get more performance out of your OpDB for OLTP use cases.
Plan Analyzer and Pre-binding
When using Apache Phoenix for your OLTP use cases, you can use the EXPLAIN <query> Phoenix command syntax as a plan analyzer and tune the optimization plans. EXPLAIN <query> command computes the logical steps needed to execute a command. Each step is represented as a string in a single column result.
For example, the command in this example will give you a list of logical steps used when running the query. You can rewrite your queries to meet your performance goals. You can also bind the EXPLAIN plan to tune optimization plans. But note that it does not automatically bind it to SQL statements without the intervention of a database administrator.
Example command:
EXPLAIN SELECT NAME, COUNT(*) FROM TEST GROUP BY NAME HAVING COUNT(*) > 2;
EXPLAIN SELECT entity_id FROM CORE.CUSTOM_ENTITY_DATA WHERE organization_id=’00D300000000ARP’ AND SUBSTR(entity_id,1,4) = ‘002’ AND created_date < CURRENT_DATE()-1;
For more information, see Explain Plan.
Supported Indexing Types
Indexes are used in OpDB as an orthogonal way of accessing data from its primary data access path. Apache Phoenix in OpDB automatically uses indexes to service a query. Phoenix supports global and local indexes. Each is useful in specific scenarios and has its own performance characteristics.
The following tables list the index type, and index techniques. You can use a combination of index type and index techniques based on your use case. For example, you can choose to use the covered index type along with a global index. In OpDB, all index types are partitioned by default.
You can also use Cloudera Search for indexing. Using Cloudera Search, near-real time indexes allow the search of the data in the database – no explicit columns or properties are required in index creation – and mapping that to the primary key. A second GET based on the primary key allows fast retrieval of the row.
Suggestions for typical scenarios:
- Use global indexes for read-heavy use cases. Use covered-global index to save on read-time overheads.
- Global indexes are used to co-locate related information.
- Use local indexes for write-heavy use cases. Use functional-local index on arbitrary expressions to query specific combinations of index queries.
- A local index is an in-partition index which is optimized for writes but requires more data to be read to answer a query.
- If your table is large, you can use the ASYNC keyword with CREATE INDEX to create an index asynchronously.
| Index Type | Description | |
| Covered | Bundle data column with index columns.
Benefits: Save read-time overhead by only access index entry. Example: CREATE INDEX my_index ON exp_table (v1,v2) INCLUDE(v3) will create indexes on the v1 and v2 columns and include the v3 column as well. |
|
| Functional | Create an index on arbitrary expressions.
Benefits: Useful for certain combinations of index queries. Example: CREATE INDEX UPPER_NAME ON EMP (UPPER(FIRST_NAME||’ ‘||LAST_NAME)) to create a functional index so that you can do case insensitive searches on the combined first name and last name of a person using SELECT EMP_ID FROM EMP WHERE UPPER(FIRST_NAME||’ ‘||LAST_NAME)=’EXP_NAME’ |
| Index Technique | Description | |
| Global | Use Global indexing technique when you have read heavy use cases. Each global index is stored in its own table, and thus is not co-located with the data table.
A Global index is a covered index. It is used for queries only when all columns in that query are included in that index. Example: Create covered index CREATE INDEX exp_index ON exp_table (v1) INCLUDE (v2) Create global index CREATE INDEX my_index ON exp_table (v1) |
|
| Local | You can use local indexes for WRITE-heavy use cases. Each local index is stored within the data table.
Example: Create covered index CREATE INDEX exp_index ON exp_table (v1) INCLUDE (v2) Create local index CREATE LOCAL INDEX my_index ON exp_table (v1) |
Manual Tuning Parameters
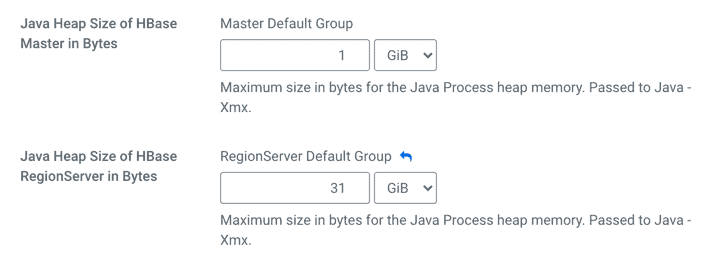
Cloudera Manager provides configuration parameters that can help tune the database. The changes can be applied using the directly exposed parameters or using the safety-valve option. You can modify the RegionServer and Master heap sizes using Cloudera Manager > Resource Management configuration option.
When you set your RegionServer heap size above 32 GiB, you will be using 64 bit addresses, so your object references will use 8 bytes instead of 4 bytes. If you set anything between Xmx32G and Xmx38G, you could reduce the amount of heap available for your application.

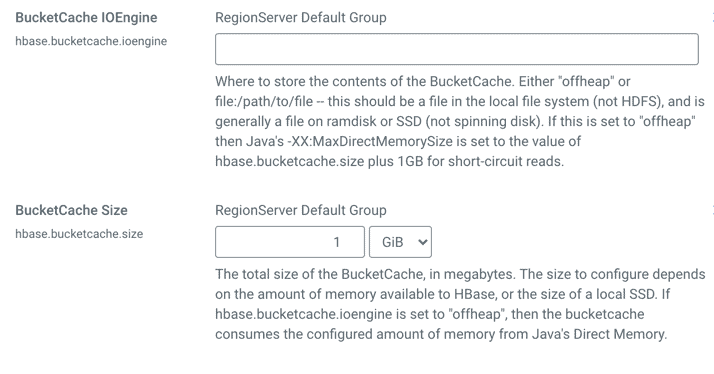
If the BucketCache is enabled, it stores data blocks, leaving the on-heap cache free for storing indexes and Bloom filters. The physical location of the BucketCache storage can be either in memory (off-heap) or in a file stored in a fast disk.

For more information about BucketCache and configuring cache, see https://docs.cloudera.com/runtime/7.2.0/configuring-hbase/topics/hbase-offheap-bucketcache.html.
Examples such as setting garbage collection pauses, request handler thread counts can help tune the database.
Automated Tuning Advisor and Tuning Tools
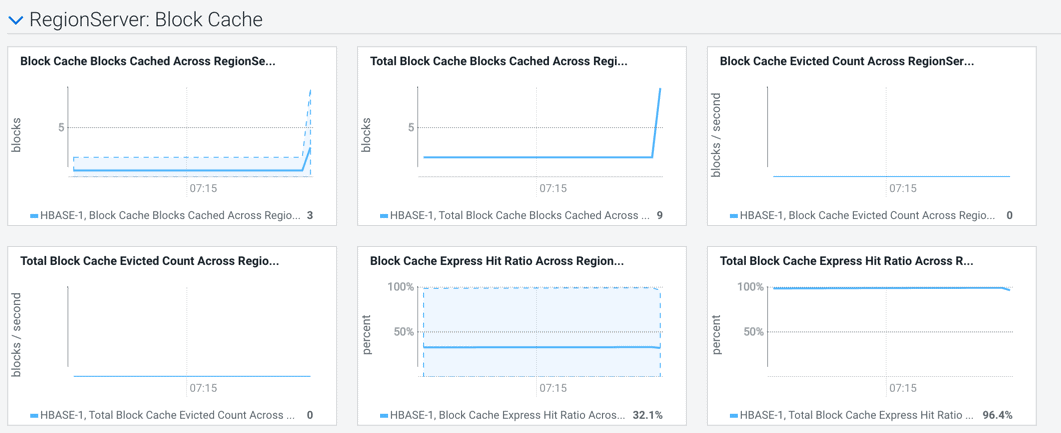
Cloudera Manager provides raw metrics and built-in workload graphs to help analyze the change in tuning parameters. OpDB provides tuning tools for some capabilities like managing cache sizes for read and write cache with a rules-engine based AI. You can also use OpDB capabilities to script additional automatic tuning functions including metrics, mechanisms to automate node addition, removal, and deploy configuration changes.
Memory Buffer Management and Control
Cloudera Manager provides features to tune the memory management configurations like bucket cache.

You can also monitor the throub the raw metrics or through the built-in graphs as well.

In-memory Column-store
Cloudera’s OpDB is a wide-column store that is optimized for both operational and analytical workloads. The amount of data maintained in memory is related to the size of the configured block-store which means that all data can be operated in memory (exactly like an in-memory database) if a sufficient amount of memory is provided in the cluster. OpDB with its in-memory components scale-out horizontally.
You can update all the data including the in-memory column-store without the need for a synchronization mechanism.
Server Clustering and Limitations
By default, Cloudera’s OpDB is a clustered solution that scales to billions of rows and millions of columns. The largest clustered implementation can exceed 1,500 servers in a single cluster. There are no maximum data storage limitations, and you can store more than 2.5 PB of data in a single instance.
Most users run multiple applications on a single cluster. You can manage OpDB at both the cluster level using Cloudera Manager as well as the client application level. You can run data warehousing, data streaming, and the OpDB all on a single cluster. OpDB uses many different buffers to support managing the I/O load on the database including inter-process buffers, inter-node buffers, inter-cluster buffers, shared buffers for input and output.
Storage Control for Data Placement
By default, data is spread across multiple nodes. Tables and namespaces can also be isolated to specific subsets of nodes either alone or in specified groups. This capability gives you the ability to control data placement.
Parallel Query Execution
Queries are parallelized by default by chunking up the query using region boundaries and running them in parallel on the client using a configurable number of threads. Aggregations are done on the server-side reducing the amount of data that gets returned back to the client rather than returning all the data and doing the same on the client-side.
Instruction Parallelism and Parallel Utility Execution
Instruction parallelism is supported in OpDB. Backup and recovery, space reclamation, and index rebuilds are all done in parallel by default.
Compression
There are multiple compression algorithms that can be applied at the Column or ColumnFamily level (depending on the storage engine used). Examples are Snappy, LZO, GZIP. Snappy and LZO can be pre-installed on the cluster and then enabled on the column family. There is no extra cost for enabling these compressions.
There is block data encoding that could be achieved at the row level to provide this feature. For example, FastDiffDeltaEncoding can be used which tries to store only the diffs between the rows. For some data, for low-cardinality data stored in a columnar form, we recommend the encoding choice be based on the type of the column. Supported types include Bitshuffle Encoding, Runlength Encoding, Dictionary Encoding, and Prefix Encoding. Encoding can significantly reduce the footprint of data on disk.
Conclusion
For more information about Cloudera’s Operational Database offering, see Cloudera Operational Database.


