This guest post from Intel Java performance architect Eric Kaczmarek (originally published here) explores how to tune Java garbage collection (GC) for Apache HBase focusing on 100% YCSB reads.
Apache HBase is an Apache open source project offering NoSQL data storage. Often used together with HDFS, HBase is widely used across the world. Well-known users include Facebook, Twitter, Yahoo, and more. From the developer’s perspective, HBase is a “distributed, versioned, non-relational database modeled after Google’s Bigtable, a distributed storage system for structured data”. HBase can easily handle very high throughput by either scaling up (i.e., deployment on a larger server) or scaling out (i.e., deployment on more servers).
From a user’s point of view, the latency for each single query matters very much. As we work with users to test, tune, and optimize HBase workloads, we encounter a significant number now who really want 99th percentile operation latencies. That means a round-trip, from client request to the response back to the client, all within 100 milliseconds.
Several factors contribute to variation in latency. One of the most devastating and unpredictable latency intruders is the Java Virtual Machine’s (JVM’s) “stop the world” pauses for garbage collection (memory clean-up).
To address that, we tried some experiments using Oracle jdk7u21 and jdk7u60 G1 (Garbage 1st) collector. The server system we used was based on Intel Xeon Ivy-bridge EP processors with Hyper-threading (40 logical processors). It had 256GB DDR3-1600 RAM, and three 400GB SSDs as local storage. This small setup contained one master and one slave, configured on a single node with the load appropriately scaled. We used HBase version 0.98.1 and local filesystem for HFile storage. HBase test table was configured as 400 million rows, and it was 580GB in size. We used the default HBase heap strategy: 40% for blockcache, 40% for memstore. YCSB was used to drive 600 work threads sending requests to the HBase server.
The following charts shows jdk7u21 running 100% read for one hour using -XX:+UseG1GC -Xms100g -Xmx100g -XX:MaxGCPauseMillis=100. We specified the garbage collector to use, the heap size, and the desired garbage collection (GC) “stop the world” pause time.
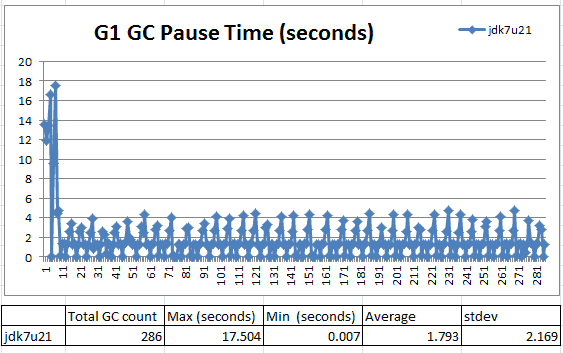
Figure 1: Wild swings in GC Pause time
In this case, we got wildly swinging GC pauses. The GC pause had a range from 7 milliseconds to 5 full seconds after an initial spike that reached as high as 17.5 seconds.
The following chart shows more details, during steady state:
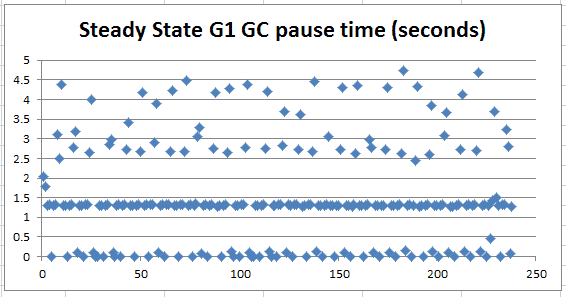
Figure 2: GC pause details, during steady state
Figure 2 tells us the GC pauses actually comes in three different groups: (1) between 1 to 1.5 seconds; (2) between 0.007 seconds to 0.5 seconds; (3) spikes between 1.5 seconds to 5 seconds. This was very strange, so we tested the most recently released jdk7u60 to see if the data would be any different:
We ran the same 100% read tests using exactly the same JVM parameters: -XX:+UseG1GC -Xms100g -Xmx100g -XX:MaxGCPauseMillis=100.
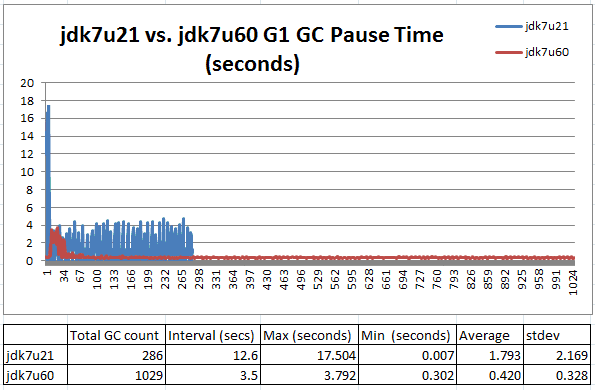
Figure 3: Greatly improved handling of pause time spikes
Jdk7u60 greatly improved G1’s ability to handle pause time spikes after initial spike during settling down stage. Jdk7u60 made 1029 Young and mixed GCs during a one hour run. GC happened about every 3.5 seconds. Jdk7u21 made 286 GCs with each GC happening about every 12.6 seconds. Jdk7u60 was able to manage pause time between 0.302 to 1 second without major spikes.
Figure 4, below, gives us a closer look at 150 GC pauses during steady state:
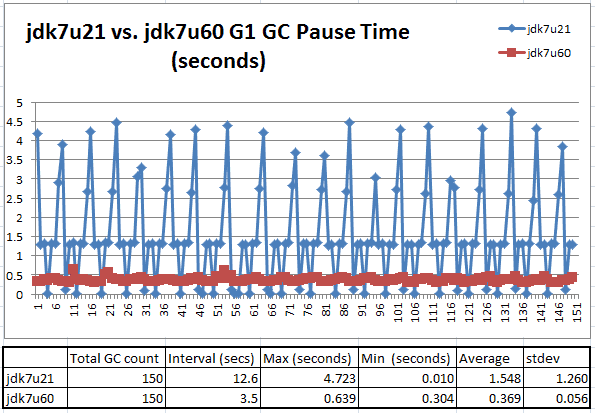
Figure 4: Better, but not good enough
During steady state, jdk7u60 was able to keep the average pause time around 369 milliseconds. It was much better than jdk7u21, but it still did not meet our requirement of 100 milliseconds given by –Xx:MaxGCPauseMillis=100.
To determine what else we could do to get our 100 million seconds pause time, we needed to understand more about the behavior of the JVM’s memory management and G1 (Garbage First) garbage collector. The following figures show how G1 works on Young Gen collection.
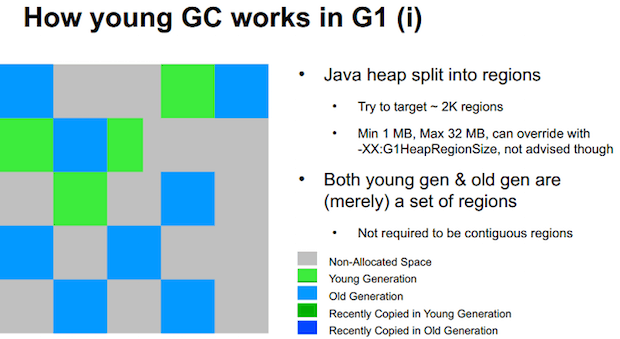
Figure 5: Slide from the 2012 JavaOne presentation by Charlie Hunt and Monica Beckwith: “G1 Garbage Collector Performance Tuning”
When the JVM starts, based on the JVM launching parameters, it asks the operating system to allocate a big continuous memory chunk to host the JVM’s heap. That memory chunk is partitioned by the JVM into regions.
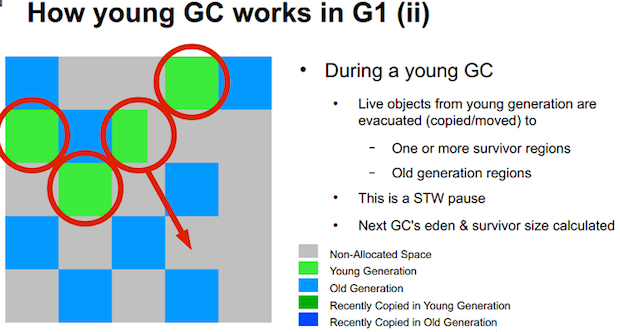
Figure 6: Slide from the 2012 JavaOne presentation by Charlie Hunt and Monica Beckwith: “G1 Garbage Collector Performance Tuning”
As Figure 6 shows, every object that the Java program allocates using the Java API first comes to the Eden space in the Young generation on the left. After a while, the Eden becomes full, and a Young generation GC is triggered. Objects that still are referenced (i.e., “alive”) are copied to Survivor space. When objects survive several GCs in the Young generation, they get promoted to the Old generation space.
When Young GC happens, the Java application’s threads are stopped in order to safely mark and copy live objects. These stops are the notorious “stop-the-world” GC pauses, which make the applications non-responding until the pauses are over.
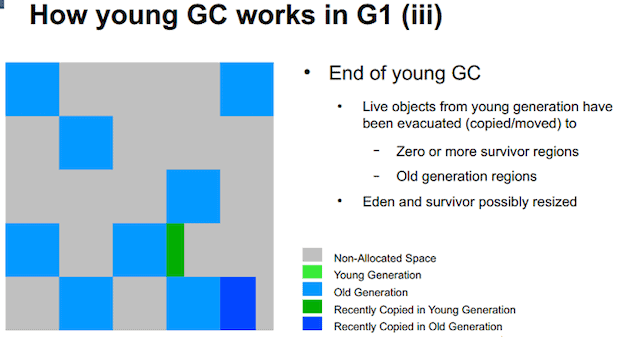
Figure 7: Slide from the 2012 JavaOne presentation by Charlie Hunt and Monica Beckwith: “G1 Garbage Collector Performance Tuning”
The Old generation also can become crowded. At a certain level—controlled by -XX:InitiatingHeapOccupancyPercent=? where the default is 45% of total heap—a mixed GC is triggered. It collects both Young gen and Old gen. The mixed GC pauses are controlled by how long the Young gen takes to clean-up when mixed GC happens.
So we can see in G1, the “stop the world” GC pauses are dominated by how fast G1 can mark and copy live objects out of Eden space. With this in mind, we will analyze how the HBase memory allocation pattern will help us tune G1 GC to get our 100 milliseconds desired pause.
In HBase, there are two in-memory structures that consume most of its heap: The BlockCache, caching HBase file blocks for read operations, and the Memstore caching the latest updates.

Figure 8: In HBase, two in-memory structures consume most of its heap.
The default implementation of HBase’s BlockCache is the LruBlockCache, which simply uses a large byte array to host all the HBase blocks. When blocks are “evicted”, the reference to that block’s Java object is removed, allowing the GC to relocate the memory.
New objects forming the LruBlockCache and Memstore go to the Eden space of Young generation first. If they live long enough (i.e., if they are not evicted from LruBlockCache or flushed out of Memstore), then after several Young generations of GCs, they makes their way to the Old generation of the Java heap. When the Old generation’s free space is less than a given threshOld (InitiatingHeapOccupancyPercent to start with), mixed GC kicks in and clears out some dead objects in the Old generation, copies live objects from the Young gen, and recalculates the Young gen’s Eden and the Old gen’s HeapOccupancyPercent. Eventually, when HeapOccupancyPercent reaches a certain level, a FULL GC happens, which makes huge “stop the world” GC pauses to clean-up all dead objects inside the Old gen.
After studying the GC log produced by “-XX:+PrintGCDetails -XX:+PrintGCTimeStamps -XX:+PrintAdaptiveSizePolicy“, we noticed HeapOccupancyPercent never grew large enough to induce a full GC during HBase 100% read. The GC pauses we saw were dominated by Young gen “stop the world” pauses and the increasing reference processing over the time.
Upon completing that analysis, we made three groups of changes in the default G1 GC setting:
- Use
-XX:+ParallelRefProcEnabledWhen this flag is turned on, GC uses multiple threads to process the increasing references during Young and mixed GC. With this flag for HBase, the GC remarking time is reduced by 75%, and overall GC pause time is reduced by 30%. Set -XX:-ResizePLAB and -XX:ParallelGCThreads=8+(logical processors-8)(5/8)Promotion Local Allocation Buffers (PLABs) are used during Young collection. Multiple threads are used. Each thread may need to allocate space for objects being copied either in Survivor or Old space. PLABs are required to avoid competition of threads for shared data structures that manage free memory. Each GC thread has one PLAB for Survival space and one for Old space. We would like to stop resizing PLABs to avoid the large communication cost among GC threads, as well as variations during each GC.We would like to fix the number of GC threads to be the size calculated by 8+(logical processors-8)(5/8). This formula was recently recommended by Oracle.With both settings, we are able to see smoother GC pauses during the run.- Change
-XX:G1NewSizePercentdefault from 5 to 1 for 100GB heapBased on the output from-XX:+PrintGCDetails and -XX:+PrintAdaptiveSizePolicy, we noticed the reason for G1’s failure to meet our desired 100GC pause time was the time it took to process Eden. In other words, G1 took an average 369 milliseconds to empty 5GB of Eden during our tests. We then changed the Eden size using-XX:G1NewSizePercent=flag from 5 down to 1. With this change, we saw GC pause time reduced to 100 milliseconds.
From this experiment, we found out G1’s speed to clean Eden is about 1GB per 100 milliseconds, or 10GB per second for the HBase setup that we used.
Based on that speed, we can set -XX:G1NewSizePercent= so the Eden size can be kept around 1GB. For example:
- 32GB heap,
-XX:G1NewSizePercent=3 - 64GB heap, –
XX:G1NewSizePercent=2 - 100GB and above heap,
-XX:G1NewSizePercent=1 - So our final command-line options for the HRegionserver are:
-XX:+UseG1GC-Xms100g -Xmx100g(Heap size used in our tests)-XX:MaxGCPauseMillis=100(Desired GC pause time in tests)- –
XX:+ParallelRefProcEnabled -XX:-ResizePLAB-XX:ParallelGCThreads= 8+(40-8)(5/8)=28-XX:G1NewSizePercent=1
Here is GC pause time chart for running 100% read operation for 1 hour:
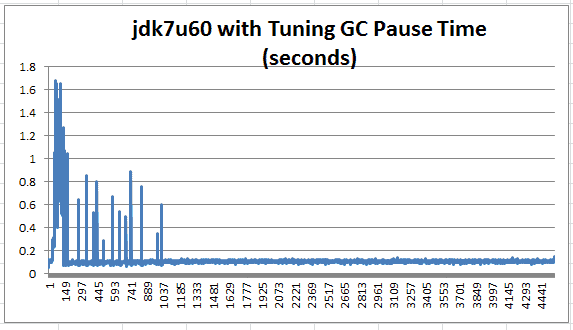
Figure 9: The highest initial settling spikes were reduced by more than half.
In this chart, even the highest initial settling spikes were reduced from 3.792 seconds to 1.684 seconds. The most initial spikes were less than 1 second. After the settlement, GC was able to keep pause time around 100 milliseconds.
The chart below compares jdk7u60 runs with and without tuning, during steady state:
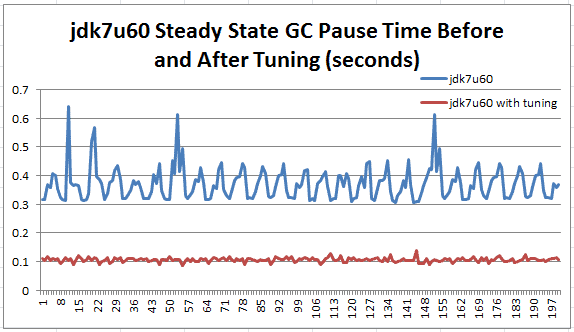
Figure 10: jdk7u60 runs with and without tuning, during steady state.
The simple GC tuning we described above gives ideal GC pause times, around 100 milliseconds, with average 106 milliseconds and 7 milliseconds standard deviation.
Summary
HBase is a response-time-critical application that requires GC pause time to be predictable and manageable. With Oracle jdk7u60, based on the GC information reported by -XX:+PrintGCDetails -XX:+PrintGCTimeStamps -XX:+PrintAdaptiveSizePolicy, we are able to tune the GC pause time down to our desired 100 milliseconds.
Eric Kaczmarek is a Java performance architect in Intel’s Software Solution Group. He leads the effort at Intel to enable and optimize Big Data frameworks (Hadoop, HBase, Spark, Cassandra) for Intel platforms.
Software and workloads used in performance tests may have been optimized for performance only on Intel microprocessors. Performance tests, such as SYSmark and MobileMark, are measured using specific computer systems, components, software, operations and functions. Any change to any of those factors may cause the results to vary. You should consult other information and performance tests to assist you in fully evaluating your contemplated purchases, including the performance of that product when combined with other products.
Intel processor numbers are not a measure of performance. Processor numbers differentiate features within each processor family. Not across different processor families. Go to: http://www.intel.com/products/processor_number.
Copyright 2014 Intel Corp. Intel, the Intel logo and Xeon are trademarks of Intel Corporation in the U.S. and/or other countries.


