THIS IS PART 2 OF A THREE-PART SERIES (Part 1, Part 3) OF DOING ULTRA FAST OLAP ANALYTICS WITH APACHE HIVE AND DRUID
Modern corporations are increasingly looking for near real time analytics and insights to make actionable decisions. To help organizations understand more about the benefits of Apache Hive and Druid, we will focus on how you can achieve sub-second analytics with Apache Hive and Druid.
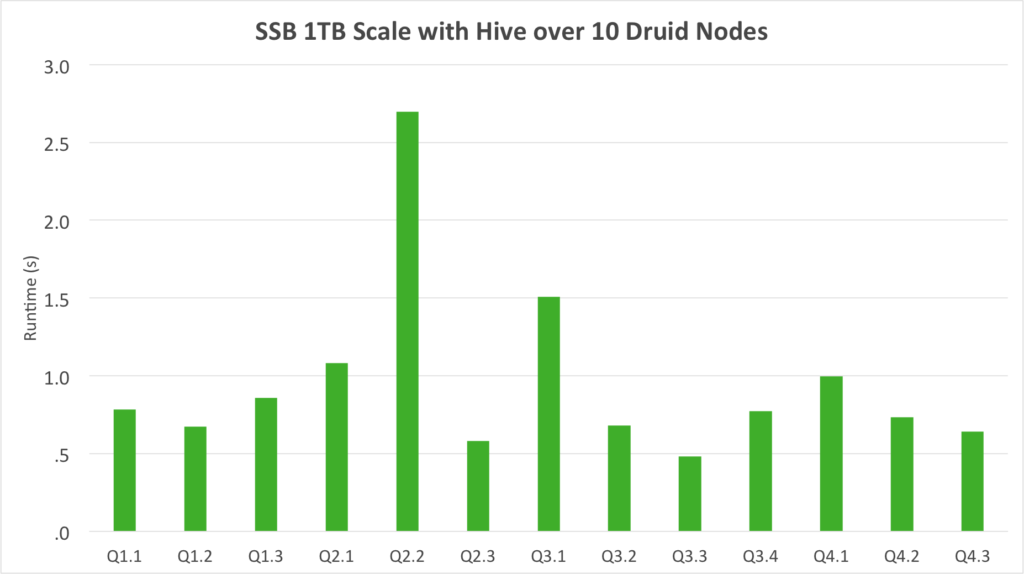
Earlier we talked about the reasons for integrating Hive and Druid, including blazing fast queries, high-dimensional analytics and support for real-time architectures. Today we present results of an OLAP benchmark at 1TB scale that show an average query response time of less than 1 second, and truly interactive response times across the entire suite of queries.

SSB 1TB Scale with Hive over 10 Druid Nodes
Taking Hive/Druid out for a Spin: The SSB Benchmark and Queries
The Star-Schema Benchmark, or SSB Benchmark, is “designed to measure performance of database products in support of classical data warehousing applications”. The SSB is based on TPC-H but differs in a number of ways: particularly in the way the largest tables are pre-joined to facilitate faster analytics. Overall the SSB is meant to simulate the process of iteratively and interactively querying a data warehouse to play what-if scenarios, drill down and better understand trends, as opposed to the pre-canned, batch-style reports used by TPC-H. It’s vital that these sorts of queries are answered within a few seconds.
The SSB Queries
The SSB queries are all spelled out in the specification document linked above, but let’s look at one query, Q4.2, to get the flavor of the benchmark:
select
d_year, s_nation, p_category,
sum(lo_revenue – lo_supplycost) as profit
from
dates, customer, supplier, part, lineorder
where
lo_custkey = c_custkey
and lo_suppkey = s_suppkey
and lo_partkey = p_partkey
and lo_orderdate = d_datekey
and c_region = ‘AMERICA’
and s_region = ‘AMERICA’
and (d_year = 1997 or d_year = 1998)
and (p_mfgr = ‘MFGR#1’ or p_mfgr = ‘MFGR#2’)
group by
d_year, s_nation, p_category
order by
d_year, s_nation, p_category;
The query involves all tables in the star schema and places fairly tight dimensional filters on each dimension table. The SSB authors model the approximate number of rows each query will access and show that Query 4.2 requires access to less than 0.5% of the total rows, making it a great query to test whether Druid’s indexing delivers fast analytics.
Building the OLAP Index from Hive
Here is the Hive query used to build the OLAP index. This query and more is available on GitHub if you want to reproduce the entire benchmark.
create database ssb_druid;
use ssb_druid;
set hive.druid.metadata.uri=jdbc:mysql://db.example.com/druid_benchmark;
set hive.druid.indexer.partition.size.max=9000000;
set hive.druid.indexer.memory.rownum.max=100000;
set hive.tez.container.size=16000;
set hive.tez.java.opts=-Xmx10g -XX:MaxDirectMemorySize=1024g -Duser.timezone=”America/New_York”;
set hive.llap.execution.mode=none;
CREATE TABLE ssb_druid_month
STORED BY ‘org.apache.hadoop.hive.druid.DruidStorageHandler’
TBLPROPERTIES (
“druid.datasource” = “ssb_druid_day”,
“druid.segment.granularity” = “MONTH”,
“druid.query.granularity” = “DAY”)
AS
SELECT
cast(d_year || ‘-‘ || d_monthnuminyear || ‘-‘ || d_daynuminmonth as timestamp) as `__time`,
cast(c_city as string) c_city,
cast(c_nation as string) c_nation,
cast(c_region as string) c_region,
cast(d_weeknuminyear as string) d_weeknuminyear,
cast(d_year as string) d_year,
cast(d_yearmonth as string) d_yearmonth,
cast(d_yearmonthnum as string) d_yearmonthnum,
cast(lo_discount as string) lo_discount,
cast(lo_quantity as string) lo_quantity,
cast(p_brand1 as string) p_brand1,
cast(p_category as string) p_category,
cast(p_mfgr as string) p_mfgr,
cast(s_city as string) s_city,
cast(s_nation as string) s_nation,
cast(s_region as string) s_region,
lo_revenue,
lo_extendedprice * lo_discount discounted_price,
lo_revenue – lo_supplycost net_revenue
FROM
ssb_1000_flat_orc.customer, ssb_1000_flat_orc.dates,
ssb_1000_flat_orc.lineorder,
ssb_1000_flat_orc.part, ssb_1000_flat_orc.supplier
where
lo_orderdate = d_datekey and lo_partkey = p_partkey
and lo_suppkey = s_suppkey and lo_custkey = c_custkey;
There are some important things to call out here:
- The segment granularity controls the granularity of physical partitions by time in Druid. Segments are atomic units in Druid, if you need to update data in Druid, for example if you had bad upstream data, you will need to re-build the entire segment, so there is a trade-off between how many segments you have and the speed at which you can build a segment.
- The query granularity controls how aggressively to pre-aggregate data in Druid. Pre-aggregation is key to boosting performance. On the other hand a time series query can never go finer-grained than the query granularity, so a balance needs to be struck between performance and flexibility. In our example we use daily query granularity, meaning it would be impossible to query a sum of values during the hours of 5 to 7 PM.
- String values are automatically treated as dimensions and numeric values are automatically treated as measures. Aggregates like sum, min, max, etc. are automatically made for all measures. Building aggregates from Hive is extremely simple and skips a lot of the routine work you often need to do in other tools.
Architecting the OLAP Index
How did we arrive at the query used to build the OLAP index? There is a systematic procedure:
- The union of all dimensions used by the SSB queries is included in the index.
- The union of all measures is included in the index. Notice that we pre-compute some products in the index.
- Druid requires a timestamp, so the date of the transaction is used as the timestamp.
You can see that building the index requires knowledge of the query patterns. Either an expert in the query patterns architects the index, or a tool is needed to analyze queries or to dynamically build indexes on the fly. A lot of time can be spent in this architecture phase, gathering requirements, designing measures and so on, because changing your mind after-the-fact can be very difficult.
Query Adjustments
One important difference between reporting queries and BI queries is that reporting queries usually sort by some specific measure because they’re going to end up on a static medium like an email or a piece of paper. BI tools generally handle sorting on the client side where it is dynamic and flexible, and generally don’t rely on the database to sort.
To better simulate the BI experience a user would get from a BI tool like Tableau, we eliminated the ORDER BY clauses from the 10/13 SSB queries that include them.
One other cosmetic adjustment was made to convert “between” predicates into 2 separate inequality predicates. Automatic handling of “between” clauses is an in-progress work item.
Let’s take a look at the re-written Q4.2 that targets our OLAP index:
select
d_year, s_nation, p_category,
sum(net_revenue) as profit
from
ssb_druid
where
c_region = ‘AMERICA’
and s_region = ‘AMERICA’
and (d_year = ‘1997’ or d_year = ‘1998’)
and (p_mfgr = ‘MFGR#1’ or p_mfgr = ‘MFGR#2’)
group by
d_year, s_nation, p_category;
The changes here are that we remove the ORDER BY and issue the query to the denormalized OLAP index directly. All the dimension filters remain the same. Although we issue this query to Hive, it is answered entirely from the Druid layer. The full text of the Hive SQL queries used for this test are available on GitHub.
Performance Results at Scale 1000
To benchmark the Hive/Druid integration, the SSB queries were run via JDBC through HiveServer2 and backed by Druid. We see interactive response times for all queries: The average runtime was 960 milliseconds with a minimum runtime of 481 milliseconds and a maximum of 2700 milliseconds.

For additional reference here are the specifics of the cluster where these numbers were generated:
- 10 nodes
- 2x Intel(R) Xeon(R) CPU E5-2640 v2 @ 2.00GHz with 16 CPU threads each
- 256 GB RAM per node
- 6x WDC WD4000FYYZ-0 1K02 4TB SCSI disks per node
The GitHub repo also contains some additional tuning notes with detailed Java command line arguments.
It’s worth mentioning that the actual cube size on disk is around 200 GB, in large part due to pre-aggregation. The workload operates in-memory, but could operate with a much smaller memory footprint.
Try It Today
Druid is available as a Technical Preview in HDP 2.6. In addition to the Hive/Druid integration, Hortonworks has made it easy to deploy, configure and monitor Druid using Apache Ambari, making it easy to get started. With these simplifications, a knowledgeable Hadoop user should be able to reproduce anything in this document within a few hours with the help of the materials on GitHub. We encourage you to try Druid, in HDP or on Hortonworks Data Cloud and give us your feedback in the Hortonworks Community.


