

This blog post will provide guidance to administrators currently using or interested in using Kafka nodes to maintain cluster changes as they scale up or down to balance performance and cloud costs in production deployments. Kafka brokers contained within host groups enable the administrators to more easily add and remove nodes. This creates flexibility to handle real-time data feed volumes as they fluctuate.
Goal
Kafka as an event stream can be applied to a wide variety of use cases. It can be difficult to define the proper number of Kafka nodes at the initialization stage of a cluster. Inevitably in any production deployment, the number of Kafka nodes required to maintain a cluster can change. Balancing performance and cloud costs requires that administrators scale up or scale down accordingly. For instance, there may be a few weeks or months that are peak times in the year and the baseline might require different throughputs. So scaling would be useful in many cases.
From the “scaling up” point of view, sometimes there will be new tasks for Kafka to handle and one or a few nodes may become overloaded. For example, three nodes could handle the load when a business just started; in contrast some time later the volume of data to manage can increase exponentially, so the three brokers would be overloaded. In this case new Kafka worker instances have to be added. It can be a hard task to set up brokers manually, and if it is done then another problem to solve is to reallocate duty/load from existing brokers to the new one(s).
Furthermore, from the “scaling down” point of view, we might realize the initial Kafka cluster is too big and we would like to reduce our nodes in the cloud to control our spending. It is really hard to manage this way since we have to remove everything from the chosen Kafka broker(s) before the broker role can be deleted and the node can be erased.
The scaling functionality addresses this need in a secure way while minimizing the possibility of data loss and any other side effects (they can be found in the “scaling down” section). Cloudera provides this feature from the Cloudera Data Platform (CDP) Public Cloud 7.2.12 release.
The Apache Kafka brokers provisioned with the Light- and Heavy duty versions (even High Availability – Multi-AZ – versions) of the Streams Messaging cluster definitions can be scaled. This is done by adding or removing nodes from the host groups containing Kafka brokers. During a scaling operation Cruise Control automatically rebalances partitions on the cluster.
Apache Kafka provides—by default—interfaces to add/remove brokers to/from the Kafka cluster and redistribute load among nodes, but it requires the use of low-level interfaces and custom tools. Using the Cloudera Data Platform (CDP) Public Cloud, these administrative tasks are conveniently accessible via Cloudera Manager, leveraging Cruise Control technology under the hood.
The scaling of the Kafka cluster was only manually possible in the past. All replica and partition movements (like manual JSON reassignment scripts, and so on) had to be executed manually or with some third party tools since Cruise Control was not deployed before the 7.2.12 version. The data loss and any side effect of the operation was based on the administrators of the cluster, so scaling was not so easy to execute.
Setup and pre requirements
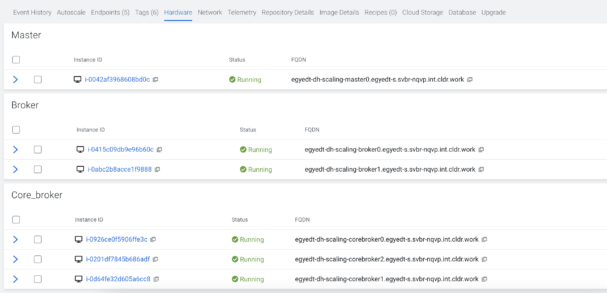
Kafka scaling features require CDP Public Cloud 7.2.12 or higher. Streams Messaging clusters running Cloudera Runtime 7.2.12 or higher have two host groups of Kafka broker nodes. These are the Core_broker and Broker host groups. New broker nodes are added to or removed from the Broker host group, during an upscale or downscale operation. The Core_broker group contains a core set of brokers that is immutable. This split is mandatory since a minimum number of brokers have to be available for Kafka to be able to work properly as a highly available service. For instance, Cruise Control cannot be used with one broker, and furthermore, without this restriction the user would be able to scale down the number of brokers to zero.
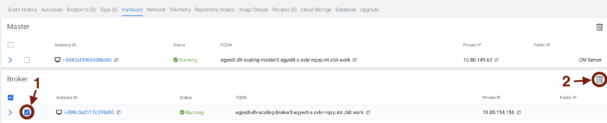
An example of the host groups can be found below.
The Kafka broker decommission feature is available when Cruise Control is deployed on the cluster. If Cruise Control is removed from the cluster for any reason, then decommission (and downscale) for Kafka brokers will be disabled. Without Cruise Control there is no automatic tool that can move data from the selected broker to the remaining ones.
Additional requirements are that the cluster, its hosts, and all its services are healthy and the Kafka brokers are commissioned and running. Cruise Control is needed for up- and downscale too. It is not allowed to restart Kafka or Cruise Control during a downscale operation. You also must not create new partitions during a downscale operation.
Verify that Cruise Control is reporting that all partitions are healthy—with the usage of the Cruise Control REST API’s state endpoint (numValidPartitions is equal to numTotalPartitions and monitoringCoveragePct is 100.0).
One more important note about downscale is that if there are any ongoing user operations in Cruise Control—which can be checked with the user_tasks endpoint –, then it will be force stopped.
The communication between Kafka and Cloudera Manager and Cruise Control is secure by default!
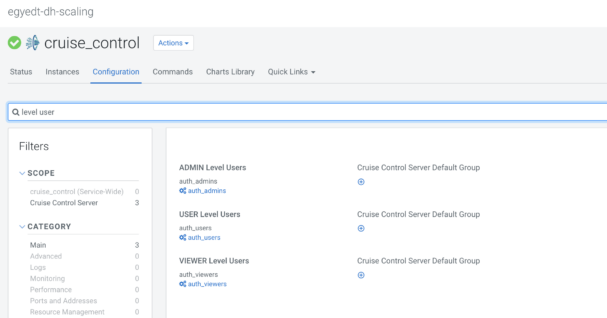
NOTE: An access level (admin, user, or viewer) must be set for the user calling the API endpoint in Cruise Control. After that the Cruise Control service has to be restarted. For more information, see Cruise Control REST API endpoints.
Scaling up
The addition of new Kafka brokers is an easier task than removing them. In the Data Hub you can add new nodes to the cluster. After that, an optional “rolling restart” of stale services is needed, since at least the Kafka and Cruise Control will recognize the changes in the cluster. So for example “bootstrap server list” and other properties as well have to be reconfigured. Fortunately, Cloudera Manager provides the “rolling restart” command, which is able to restart the services with no downtime in the case of Kafka.
There are some additional requirements to perform a complete upscale operation. Data Hub will add new instances to the cluster, but Kafka will be unbalanced without Cruise Control (there will be no load on the new brokers and already existing ones will have the same load as before). Cruise Control is able to detect anomalies in the Kafka cluster and resolve them, but we have to ensure that anomaly detection and self healing is enabled (by default on a Data Hub cluster). The following image shows which anomaly notifier and finder class have to be specified beside the enablement of self healing.
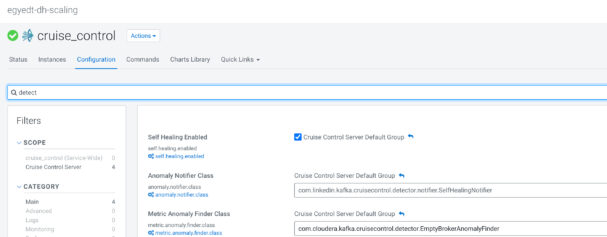
Default configurations are set for a working cluster, so modifications are only needed if mentioned properties are changed.
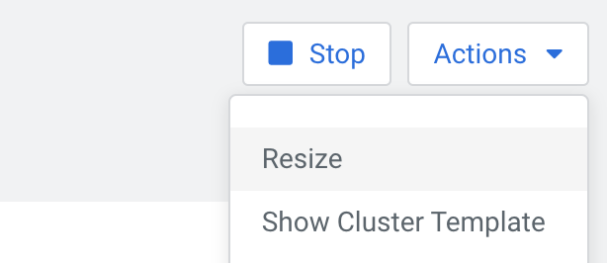
To start scaling operations, we have to select the preferred Data Hub from the Management Console > Data Hub clusters page. Go to the top right corner and click on Actions > Resize.

A pop-up dialog will ask about what type of scaling we want to run. The “broker” option has to be selected and with the “+” icon or with the required number in the text field—while we can add more brokers to our cluster, a greater number has to be specified than the current value.
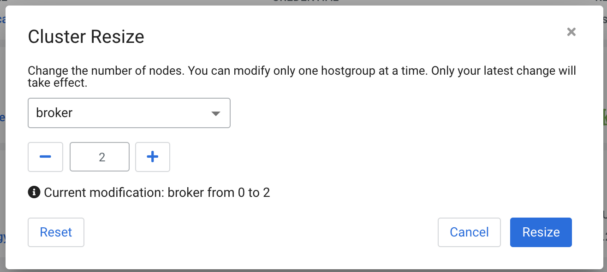
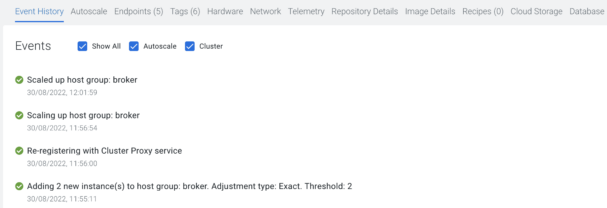
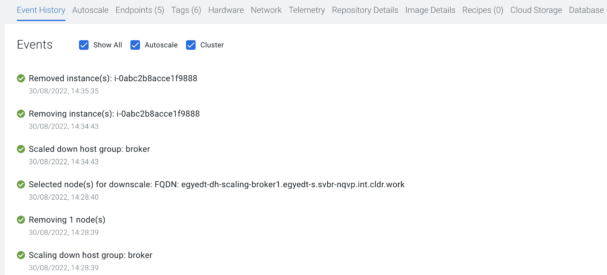
Clicking on “Resize” at the bottom left corner of the pop-up will start the progress. If “Event History” shows a “Scaled up host group: broker” text, then the Data Hub part of the process is finished.
After this we can optionally restart the stale services with a simple restart or rolling restart command from the Cloudera Manager UI, but it is not mandatory. When the restart operation finishes, then Cruise Control will take some time to detect anomalies since it is a periodic task (the interval between executions can be set by “anomaly.detection.interval.ms” property; further more specific configurations can be enabled by the following properties: goal.violation.detection.interval.ms, metric.anomaly.detection.interval.ms, disk.failure.detection.interval.ms, topic.anomaly.detection.interval.ms). If the “empty broker” anomaly is detected, then Cruise Control will try to execute a so-called “self healing” job. These events can be observed by the query of the state endpoint or the following of the Cruise Control Role logs.
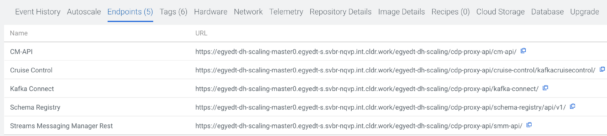
https://[***MY-DATA-HUB-CLUSTER.COM***]/cdp-proxy-api/cruise-control/kafkacruisecontrol/state?json=true
The logs will contain the following lines when detection finished and self healing started:
INFO  com.cloudera.kafka.cruisecontrol.detector.EmptyBrokerAnomalyFinder: [AnomalyDetector-6]: Empty broker detection started.

INFO  com.cloudera.kafka.cruisecontrol.detector.EmptyBrokerAnomalyFinder: [AnomalyDetector-6]: Empty broker detection finished.

WARN  com.linkedin.kafka.cruisecontrol.detector.notifier.SelfHealingNotifier: [AnomalyDetector-2]: METRIC_ANOMALY detected [ae7d037b-2d89-430e-ac29-465b7188f3aa] Empty broker detected. Self healing start time 2022-08-30T10:04:54Z.

WARN  com.linkedin.kafka.cruisecontrol.detector.notifier.SelfHealingNotifier: [AnomalyDetector-2]: Self-healing has been triggered.

INFO  com.linkedin.kafka.cruisecontrol.detector.AnomalyDetectorManager: [AnomalyDetector-2]: Generating a fix for the anomaly [ae7d037b-2d89-430e-ac29-465b7188f3aa] Empty broker detected.

INFO  com.linkedin.kafka.cruisecontrol.executor.Executor: [ProposalExecutor-0]: Starting executing balancing proposals.

INFO  operationLogger: [ProposalExecutor-0]: Task [ae7d037b-2d89-430e-ac29-465b7188f3aa] execution starts. The reason of execution is Self healing for empty brokers: [ae7d037b-2d89-430e-ac29-465b7188f3aa] Empty broker detected.

INFO  com.linkedin.kafka.cruisecontrol.executor.Executor: [ProposalExecutor-0]: Starting 111 inter-broker partition movements.

INFO  com.linkedin.kafka.cruisecontrol.executor.Executor: [ProposalExecutor-0]: Executor will execute 10 task(s)

INFO  com.linkedin.kafka.cruisecontrol.detector.AnomalyDetectorManager: [AnomalyDetector-2]: Fixing the anomaly [ae7d037b-2d89-430e-ac29-465b7188f3aa] Empty broker detected.

INFO  com.linkedin.kafka.cruisecontrol.detector.AnomalyDetectorManager: [AnomalyDetector-2]: [ae7d037b-2d89-430e-ac29-465b7188f3aa] Self-healing started successfully.

INFO  operationLogger: [AnomalyLogger-0]: [ae7d037b-2d89-430e-ac29-465b7188f3aa] Self-healing started successfully:
…
No Kafka or Cruise Control operations should be started while self-healing is running. Self healing is finished when the user_tasks endpoint’s result contain the last rebalance call with completed state:
Completed GET /kafkacruisecontrol/rebalance
Luckily, the worst case scenario with upscale is that the new broker(s) will not have any load or just partial load since the execution of the self-healing process was interrupted. In this case a manual rebalance call with POST http method type can solve the problem.
NOTE: Sometimes the anomaly detection is successful for empty brokers but the self healing is not able to start. In this case, most of the time Cruise Control goal lists (default goals, supported goals, hard goals, anomaly detection goals, and self-healing goals) have to be reconfigured. If there are too many goals, then Cruise Control may not be able to find the right proposal to manage to meet all requirements. It is useful and can solve the problem if only the relevant goals are selected and unnecessary ones are removed—at least in the self-healing and anomaly detection goals list! Furthermore, anomaly detection and self-healing goals should be as few as possible and anomaly detection goals have to be a superset of self-healing goals. Since the start of the self-healing job and the anomaly detection are periodic after reconfiguration of the goals the automatic load rebalance will be started. The cluster will be upscaled as the result of the progress. The number of Kafka broker nodes available in the broker host group is equal to the configured number of nodes.
Scaling down
The downscaling of a Kafka cluster can be complex. There are a lot of checks that we have to do to keep our data safe. This is why we have ensured the following before running the downscale operation. Data Hub nodes have to be in good condition, Kafka has to do only its usual tasks (e.g. there is no unnecessary topic/partition creation beside the normal workload). Furthermore, preferably Cruise Control has no ongoing tasks, otherwise the already in-progress execution will be terminated and the scale down will be started.
Downscale operations use so-called “host decommission” and “monitor host decommission” commands of the Cloudera Manager. The first one starts the relevant execution process, while the second manages and monitors the progress until it is finished.
Pre-requirements
The following checks/assumptions happen during every monitoring loop to ensure the process’s defense and to prevent data loss:
- Every call between the components happens in a secure way, authenticated with Kerberos protocol.
- Every call between components has a http status and JSON response validation process.
- There are some retry mechanisms (with effective wait times between them) integrated into the critical point of the execution to ensure that the error or timeout is not just a transient one.
- Two “remove brokers” tasks cannot be executed at the same time (only one can be started).
- Cruise Control reports status about the task in every loop and if something is not OK, then the remove broker process cannot be successful so there will be no data loss.
- When Cruise Control reports the task as completed, then an extra check is executed about the load of the selected broker. If there is any load on it, then the broker removal task will fail, so data loss is prevented.
- Since Cruise Control isn’t persistent, a restart of the service terminates ongoing executions. If this happens, then the broker removal task will fail.
- “Host decommission” and “monitor host decommission” commands will fail if Cloudera Manager is restarted.
- There will be an error if any of the selected brokers are restarted. Also a restart of a non-selected broker could be a problem since any of the brokers can be the target of the Cruise Control data moving. If broker restart happens, then the broker removal task will fail.
- In summary, if anything seems to be problematic, then the decommission will fail. This is a defensive approach to ensure no data loss occurs.
Downscaling with auto node selection
After setup steps are complete and meet the pre-requirements, we have to select the preferred Data Hub from the Management Console > Data Hub clusters page. Go to the top right corner and click on Actions > Resize.
A pop-up dialog will ask about what type of scaling we want to run. The “broker” option has to be selected with the “-” icon or by writing the required number into the text field—we can reduce the number of brokers in our cluster, but a lower number has to be specified than the current, and furthermore a negative value cannot be set. This will automatically select broker(s) to remove.
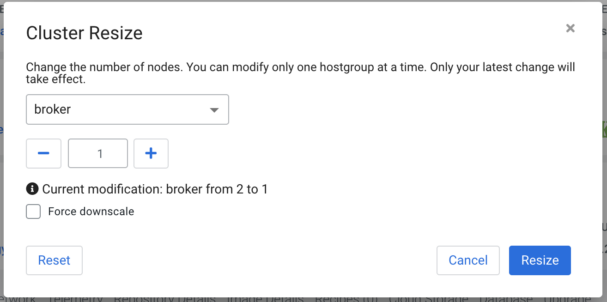
The “Force dowscale” option always removes host(s). Data loss is possible (not recommended).
Clicking on “Resize” at the bottom left corner of the pop-up will start the progress. If “Event History” shows a “Scaled up host group: broker” text, then the Data Hub part of the process is finished.
Downscaling with manual node selection
There is another option to start downscaling and the user is able to select the removable broker(s) manually this way. We have to select the preferred Data Hub from the Management Console > Data Hub clusters page. After that go to the “Hardware” section. Scroll down to the broker host group. Select the node(s) you want to remove with the check box at the beginning of every row. Click the “Delete” (trash bin) icon of the broker host group and then click “Yes” to confirm deletion. (The same process will be executed as in the automated way, just the selection of the node is the difference between them.)
Following executions and troubleshooting errors
There are some ways to follow the execution or troubleshoot errors of the Cloudera Manager decommission process. The Data Hub page has a link to the Cloudera Manager (CM-UI). After successful sign in, the Cloudera Manager’s menu has an item called “Running Commands.” This will show a pop up window where “All Recent Commands” has to be selected. The next page has a time selector at the right side of the screen where you may have to specify a greater interval than the default one (30 minutes) to be able to see the “Remove hosts from CM” command.
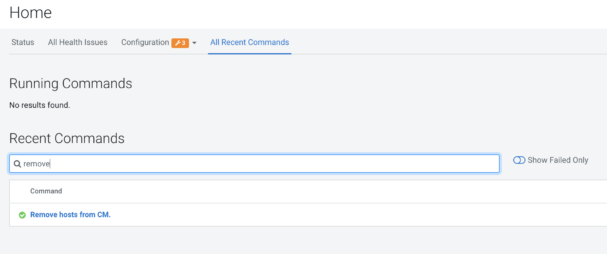
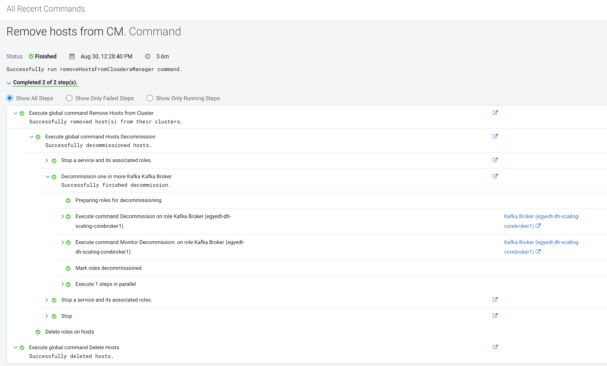
The command list contains the steps, processes and sub-processes of the commands executed before. We have to select the last “Remove hosts from CM” item. After that, the details of the removal progress will be displayed with embedded dropdowns, so the user can dig deeper. Also the standard output, standard error, and role logs of the service can be reached from here.
Result
The cluster will be downscaled as a result. The number of Kafka broker nodes available in the broker host group is equal to the configured number of nodes. Partitions are automatically moved from the decommissioned brokers. Once no load is left on the broker, the broker is fully decommissioned and removed from the broker host group.
Summary
Kafka scaling provides mechanisms to be able to get more or less Kafka nodes (brokers) than the actual number. This article explained with a thorough description how this works in the Cloudera environments, and how it can be used. For more details about Kafka, you can check the CDP product documentation. If you want to try it out yourself, then there is the trial opportunity of CDP Public Cloud.
Interested in joining Cloudera?
At Cloudera, we are working on fine-tuning Big Data related software bundles (based on Apache open-source projects) to provide our customers a seamless experience while they are running their analytics or machine learning projects on petabyte-scale datasets. Check our website for a test drive!
If You are interested in big data, would like to know more about Cloudera, or are just open to a discussion with techies, visit our fancy Budapest office at our upcoming meetups.
Or, just visit our careers page, and become a Clouderan!
Editor's Choice

