

Introduction
Many of us have experienced the feeling of hopelessly digging through log files on multiple servers to fix a critical production issue. We can probably all agree that this is far from ideal. Locating and searching log files is even more challenging when dealing with real-time processing applications where the debugging process itself can be extremely time-sensitive.
A common challenge in distributed data processing is gathering the logs from different computing nodes and organizing them in a way that can be efficiently searched later for monitoring and debugging purposes. The term used to describe this log collecting process is log aggregation.
Log Aggregation: The collecting of logs from different sources to provide a holistic view of the complete system.
There are several off-the-shelf solutions available on the market for log aggregation, which come with their own stack of components and operational difficulties. For example, notable logging frameworks that are widely used in the industry are ELK stack and Graylog.
Unfortunately, there is no clear cut solution that works for every application, and different logging solutions might be more suitable for certain use cases. The log processing of real-time applications should for instance also happen in real-time, otherwise, we lose timely information that may be required to successfully operate the system.
In this blog post, we dive deep into logging for real-time applications. More specifically we will:
- Discuss the logging requirements of streaming applications
- Inspect the components of a generic log aggregation system
- Build a scalable log aggregation framework from scratch
- Compare our custom solution with off-the-shelf tools
Logging for streaming applications
Before jumping into the logging requirements of distributed streaming applications, let’s take a step back and look at the more traditional batch processing. These applications run periodically, processing immense volumes of data and they produce production critical outputs. When there is an error during processing, we need to be able to debug it, and our logging stack should support us all the way to the solution.
We expect a few key features and properties from our logging stack for batch processing:
- Collect logs from a large number of processes
- Logs are indexed to enable free-text search
- Logs are available as soon as the processing is finished (completed or failed)
Standard file-based logging usually works for batch processing applications with a one-time log aggregation step that collects and indexes the logs at the end of the data processing. Conceptually, we can think of the log aggregation process as just another batch processing application that is triggered when the other one finishes or fails.
Unfortunately, the case of streaming applications is different. In contrast with batch applications, these jobs run 24/7 producing continuous low latency output. When problems arise, we need to start the debugging process as soon as possible. Hopefully, before it manifests as downtime for our production systems. As strange things can happen when we are not looking, we ideally want some monitoring and alerting capabilities built into the logging framework as well.
Let’s summarize the additional logging requirements of streaming applications:
- Low latency log access
- Scalability to large log sizes over time
- Monitoring / dashboarding capabilities
Decomposing the logging stack
Now that we have a clear overview of the challenges to solve, let’s take a look at the components we need in our log aggregation stack.
Most of the logging frameworks available are composed of the following four components:
- Log Appender
- Log Ingestion
- Storage & Search layer
- Dashboard & Alerting layer
Log appenders are responsible for collecting the logs from the application processes (running all over our cluster) and making sure they are sent to the downstream for ingestion. There are a variety of appenders available such as file, console, database, message queues etc.
Log ingestion is the step of taking the logs gathered by the appenders and putting them into the storage layer. This usually means cleaning and transforming the logs, and indexing them into a search engine for easier consumption by the users.
The Storage & Search layer is usually a distributed search engine, or in simpler cases a distributed file system or database where the logs are stored and accessed from.
The Dashboard & Alerting layer sits on top of the storage layer. It provides users an interactive graphical interface for searching the logs and visualizing important information. It also often includes alerting capabilities.
These components that together form our logging capabilities are also production applications themselves. In the ideal case, the parts are only loosely coupled so we can manage and operate them independently without affecting the whole pipeline. The operational complexity of the logging system as a whole greatly depends on the individual components.
Now that we have a good overview of what we need for a production grade log aggregation stack, let’s get our hands dirty and set up the whole pipeline using systems we already know from scratch.
Log aggregation with Flink, Kafka and Solr
In this initial solution, let us use the processing frameworks available at our disposal in the Cloudera platform to build a scalable and fully customizable log aggregation stack.
Our goal is to build a log aggregation pipeline that can serve our real-time data processing applications, and any data processing or other kind of application.
We implement our log aggregation components using the following systems:
- Apache Kafka log appender for scalable and low latency log collection
- Log ingestion, indexing and custom monitoring using Apache Flink
- Apache Solr for storage and search capabilities
- Hue for logging dashboards
Before diving into the nitty gritty details, let’s look at a high level example on how log messages flow from our applications all the way to the logging dashboards:
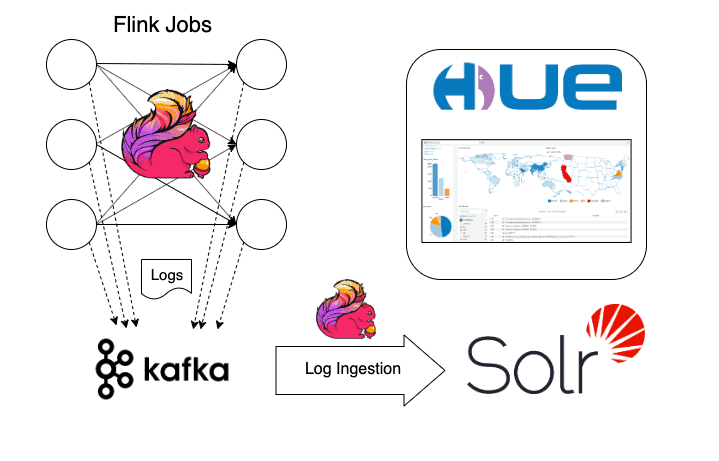
As our data processing jobs are running on multiple servers, each worker node (TaskManager in case of Flink) is producing a continuous stream of logs. These logs are automatically sent to a designated Kafka topic using a pre-configured log appender. At the same time, completely decoupled from the applications that are producing the logs, we have another Apache Flink streaming application that listens to the log messages from Kafka. This ingestor streaming job takes incoming log messages, parses them, and indexes them via our Solr search engine. Engineers responsible for the smooth operation of the streaming applications interact at the indexed logs in Solr directly or using Hue as a dashboarding tool.
Logging to Kafka
The first challenge to solve is the collection and transportation of the logs from the producing applications to the ingestor component. In general, there are several ways to tackle this problem, each with their ups and downs.
We could skip the whole log collection/transportation step altogether by directly indexing our logs to our storage layer. This would in theory give us very low latency, however it would tightly couple logging with ingestion and storage itself leading to a fragile system:
- Change in the ingestion/storage logic requires a change in the logging applications
- Downtime of the storage layer can impact running apps (or lose logs)
- The storage system itself might not scale to the number of incoming connections
Due to these reasons we strongly prefer to separate the concern of logging from ingestion. Given this key design decision we still have different ways of getting logged messages to our log ingestor.
Most applications write log files by default that are stored locally on the host machines. It is possible to periodically collect these files, but unfortunately it is quite complicated with a growing number of applications, and it also cannot provide adequate latency for our real-time requirements.
To tackle all these at once, we decided to treat logged messages as any other real-time data source and use Apache Kafka as the transportation layer. Kafka is widely used in the industry as a message bus for real-time data and provides all the features necessary for our logged messages:
- Scalable to a large number of producer apps and log messages
- Easy to integrate with existing applications
- Provides low latency transport for the logs
Most of the data processing frameworks, including Flink, are using the slf4j API so we can use our favorite Java logging framework behind the scenes to configure the appender logic.
The kafka-log4j-appender module implements a simple log4j appender that sends application logs to a desired Kafka topic. In this post we are focusing on log4j, but the concepts here can easily be adapted to other logging frameworks.
We reference the kafka appender from the Cloudera Maven repository:
<dependency>
   <groupId>org.apache.kafka</groupId>
   <artifactId>kafka-log4j-appender</artifactId>
   <version>2.3.0.7.0.3.0-79</version>
</dependency>
To start logging to Kafka the following is added to the logging configuration file (log4j.properties):
log4j.appender.kafka=org.apache.kafka.log4jappender.KafkaLog4jAppender
log4j.appender.kafka.topic=flink.logs
log4j.appender.kafka.brokerList=<your_broker_list>
In this simple config snippet, we have configured the appender class, kafka brokers and topics. When selecting a topic, we can decide to have multiple apps share the same topic or use an application specific one. As long as application logs can be distinguished from each other (more on that later), we suggest sharing the logging topic for simplified ingestion, unless company policies require separation per job or per department.
In order to simplify downstream processing, we decided to store the logs in a JSON layout. For this we used the following dependency:
<dependency>
    <groupId>net.logstash.log4j</groupId>
    <artifactId>jsonevent-layout</artifactId>
    <version>1.7</version>
</dependency>
Once we have downloaded the required jars, the layout configuration can be added to the same log4j.properties file:
log4j.appender.kafka.layout=net.logstash.log4j.JSONEventLayoutV1
Out of the box the logs we would get are just simple time-stamped messages that contain some information on the source class, hostname etc. Unfortunately, if we run similar apps or if multiple worker containers of the same data processing jobs run on the same host, it is immensely difficult to group the logged messages by the actual applications. As an efficient solution we attach the yarnContainerId to each log message, which uniquely identifies the application and the worker.
We used the UserFields optional setting to expose the yarnContainerId in our JSON logs.
log4j.appender.kafka.layout.UserFields=yarnContainerId:${yarnContainerId}
For this log4j expects the yarnContainerId to be set as a system property on the JVM (logback and log4j 2 supports resolving environment variables as well). This is not populated automagically when running Flink, but can be added using the -DyarnContainerId=… setting.
In case of Flink, the container id is already stored in the $CONTAINER_ID environment variable so we modify the env.java.opts to include this extra java property:
env.java.opts.taskmanager: -DyarnContainerId=$CONTAINER_ID ...
env.java.opts.jobmanager: -DyarnContainerId=$CONTAINER_ID ...
Now that all details are set up, let’s take a quick look at the full log4j configuration file that keeps the original file-based logging, and adds the extra Kafka logger:
log4j.rootLogger=INFO, file, kafka

# Avoid deadlock on appender start
log4j.logger.cloudera.shaded.org.apache.kafka=INFO, file
log4j.additivity.cloudera.shaded.org.apache.kafka=false


# Log all infos in the given file
log4j.appender.file=org.apache.log4j.FileAppender
log4j.appender.file.file=${log.file}
log4j.appender.file.append=false
log4j.appender.file.layout=org.apache.log4j.PatternLayout
log4j.appender.file.layout.ConversionPattern=%d{yyyy-MM-dd HH:mm:ss,SSS} %-5p %-60c %x - %m%n

log4j.appender.kafka=org.apache.kafka.log4jappender.KafkaLog4jAppender
log4j.appender.kafka.topic=flink.logs

log4j.appender.kafka.brokerList=<your_broker_list>

log4j.appender.kafka.layout=net.logstash.log4j.JSONEventLayoutV1
log4j.appender.kafka.layout.UserFields=yarnContainerId:${yarnContainerId}
We kept both the file and kafka based appenders. This populates the Flink / YARN UI logs tabs with recent data and still directs all logs to Kafka as well.
Note that there is a potential deadlock of the Kafka log appender with its own logs. To avoid this corner case, we have built a shaded version of the kafka appender where the kafka dependency is relocated to: cloudera.shaded.org.apache.kafka. The logs for these classes are directed to the file logger only. If you are using the vanilla kafka appender dependencies as a workaround, you can exclude all kafka logs from the kafka log appender.
Once we start the application the logs should be received by the the flink.logs topic. We can easily check the use of Kafka console consumer:
kafka-console-consumer --bootstrap-server <broker>:9092 --topic flink.logs
Once all is set up correctly, we should see some new messages similar to this:
{
  "source_host": "gyula-2.gce.cloudera.com",
  "method": "completePendingCheckpoint",
  "level": "INFO",
  "message": "Completed checkpoint 1 for job 5e70cf704ed010372e2007333db10cf0 (50738 bytes in 2721 ms).",
  "mdc": {},
  "yarnContainerId": "container_1571051884501_0001_01_000001",
  "@timestamp": "2019-10-14T11:21:07.400Z",
  "file": "CheckpointCoordinator.java",
  "line_number": "906",
  "thread_name": "jobmanager-future-thread-1",
  "@version": 1,
  "logger_name": "org.apache.flink.runtime.checkpoint.CheckpointCoordinator",
  "class": "org.apache.flink.runtime.checkpoint.CheckpointCoordinator"
}
A quick check of the yarnContainerId field should ensure that we have set up our flink configuration correctly.
At this point, we have everything set up on the logging side. Our application logs all end up in Kafka, ready for ingestion.
Wrapping up
At this point, we have a good overview of the challenges of logging for distributed data processing applications. We have explored the specific requirements of real-time stream processing applications and looked at the components we need for an end-to-end logging solution.
Taking on the task of building a customized log aggregation pipeline ourselves on the Cloudera platform, we have laid out our plan and started implementing our log appender and collection logic. We have successfully configured Kafka based logging for our Flink applications using JSON log format that will come in handy at the next steps when we ingest these logs.
In Part 2 we will complete our log aggregation pipeline with the ingestion and dashboarding components and look at how off-the-shelf frameworks compare to our custom solution.
Editor's Choice


Hello there,
Interesting post and certainly one of the under estimated usage of event driven architecture, but still one which will rise in the future as getting insights/real-time view on a distributed environment/system generated dozens of thousands of logs/events per sec is very challenging.
I would just add here that the very important aspect of real-time logging / log forwarding is the impact you have on the performance of the monitored source/system. When possible/mandatory, we should all use appender which are async and do block the calling threads, which is the the default implementation of log4j appenders unfortunately. Also, timestamping of events is also a very important aspect. Being able to tune the behavior of the timestamping logic is critical (should I use source/target timestamping, both?).
Very interesting article.
Stephane Marcon