Vodafone UK’s new SIEM system relies on Apache Flume and Apache Kafka to ingest nearly 1 million events per second. In this post, learn about the architecture and performance-tuning techniques and that got it there.
SIEM platforms provide a useful tool for identifying indicators of compromise across disparate infrastructure. The catch is, they’re only as accurate as the fidelity of the data involved, which is why Apache Hadoop is becoming such a valuable platform for that use case.
For that reason, Vodafone UK has designed a SIEM system built on a Hadoop-powered enterprise data hub (EDH) to consume network metadata on a national scale for the purposes of operations and fault monitoring, threat intelligence, incident response, and litigation. Vodafone UK can now collect, transport, and store network metadata from across its fixed and mobile national networks, and with that data securely stored in HDFS, analysts can run multiple types of analytic workloads concurrently—including Apache Impala (incubating) for interactive SQL queries/BI, Apache Spark MLLib for machine learning, and Cloudera Search for near-real time dashboards and multi-attribute searching.
In this post, we’ll provide an overview of this architecture and the tuning techniques we used to achieve optimal performance.
High-Level Architecture
The architecture comprises three main components: ingestion pipeline, storage, and analytics. For the purposes of this post, we will focus primarily on the ingestion of syslog data into the ingestion pipeline.
The pipeline consists of a three-tiered collection, aggregation, and edge architecture. Collection nodes are distributed geographically around the Vodafone UK network, collecting metadata from networks, IT, security, and performance-monitoring systems. Aggregation nodes are distributed in regional data centers and act as the focal points for data transport back to the rest of the cluster. Edge nodes are distributed at the periphery of the Hadoop cluster and act as the main ingress route for metadata into the Hadoop cluster itself.
There are two large obstacles to collecting metadata from a network as large as the country’s second largest telecoms provider: transporting the sheer volume of data (cumulative bandwidth), and processing it before the data no longer accurately reflected the state of the network (cumulative delay). Fortunately, combining Apache Flume and Apache Kafka using the Flafka pattern provides a means to move data into the EDH (Hadoop cluster) and to readily scale the pipeline to address transient as well as persistent spikes in data volume.
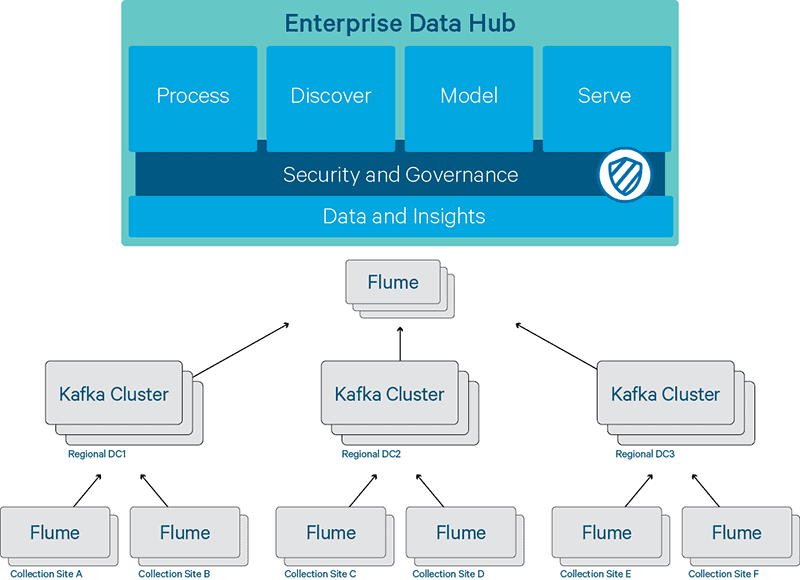
Figure 1 – National syslog pipeline architecture
Flafka allows Vodafone UK to leverage the scalability, resilience, and throughput of Kafka along with the flexibility and extensibility of Flume. It also allows us to easily configure our geographic fan-in topology with redundancy, if required.
On the collection tier, the collection nodes run Flume with a syslog source, memory channel, and Kafka producer sink. The role of these nodes is to capture network metadata and to publish it to a Kafka cluster across the WAN to the regional data centers (RDCs). The objective here is to minimize the amount of processing time for a network event by simply forwarding the event directly to one of the RDCs. A collection node is used rather than having network systems send their events directly to the RDCs, as the former approach simplifies the flow topology and provides a single control point to which the data can be directed. (For instance, in the event of an upstream RDC failure, the flow can be redirected at the collection node to another RDC, possibly using sink groups.)
On the aggregation tier, the aggregator nodes run Kafka. These nodes store network events from around the geographic network and act as caches for the upstream consumers. Kafka lets us address transient spikes in the volume of event data from the collection tier without affecting upstream analytics systems.
As you may know, Kafka implements a publish/subscribe methodology; events are written (or published) to a queue (or topic) by clients—in this case, our collection tier. This operation is transactional in nature, with a Kafka broker confirming the receipt of every batch of events. Clients can read (or consume) from a topic at will. The consumption process is non-transactional; events can be consumed as fast or as slow as the consumer can process them, and a consumer can resume or start consuming from the beginning entirely independently.
On the edge tier, the edge nodes run Flume with a Kafka consumer source, memory channel, and HDFS sink. These nodes pull metadata events from the Kafka cluster in the RDCs and write it into the HDFS cluster in buckets, where it is made available for subsequent processing/querying.
In this topology, each tier scales almost linearly. We can add nodes and/or Flume agents at the collector and edge tiers, add sources and sinks to those agents, and add more brokers to the Kafka clusters when more capacity is needed for the Kafka topics.
Performance Tuning
Scalability was a big question mark for this architecture from the outset. Because we did not collect syslog data prior to this project, we had limited visibility into what the total throughput requirements might be. On an initial test deployment, we observed around 10,000 events per second end-to-end, which led us down the performance-tuning path right away.
All testing ran on sample syslog data with an average message size of 200 bytes. (Kafka is only suitable for messages of fewer than a few KB, and similarly, Flume is designed for event-based traffic, not for moving large payloads around.) During that testing, we identified a number of candidates for tuning that provide material performance benefits:
- Number of collection tier agents and nodes
- Number of Kafka sinks per collector tier agent
- Number of Kafka brokers
- Number of Kafka topic partitions
- Kafka broker interconnect network
- Number of Kafka sources
- Number of edge tier nodes and Flume Agents per node
- Number of HDFS sinks
- Batch-sizes on all of the sinks and sources
In fact, we found that many of these areas are interrelated and therefore can’t be tuned independently.
In the following section, we’ll share some details about this tuning and pass along some advice based on our experiences.
Tuning Kafka Brokers and Partitions
An individual Kafka broker can deliver several hundreds of thousands of messages per second. For resilience, at least two brokers are required (all our partitions were created with a replication factor of 2), and in fact, we’d typically recommend a replication factor of 3 with min.insync.replicas set to 2. In general, replication traffic has a significant impact on the potential throughput of a Kafka cluster. For a replication factor of r, then r-1/r of a node’s network traffic will be replication traffic (e.g. ½ at r=2, ⅔ at r=3).
Kafka performs best when writing to dedicated disks so you should aim to have all disks writing in parallel. The number of partitions should be at least equal to the number of disks across the cluster (divided by the replication factor)—and if anything should be some multiple thereof as it reduces the chance of hot-spotting one disk if you are unable to saturate all the partitions simultaneously.
Kafka likes to do its reading from page cache. The absolute maximum performance occurs when all writes are written to disk sequentially and all reads can be retrieved from the page cache. If, for whatever reason, the consumers lag the producers so far that the page cache does not contain the requested offsets, then the disks need to constantly switch between reading and writing and from different parts of the disk. In this case, write and read performance become unstable. If you need high-write throughput and also consumers that will lag the producers, you will need to either add memory to the brokers or add brokers to the cluster.
Number of Kafka Sinks (Producers)
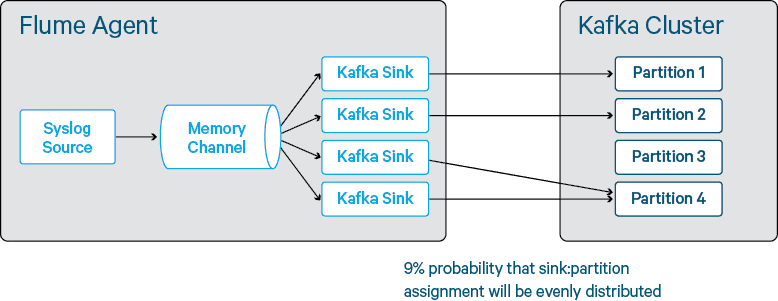
In Kafka 0.8, producers are all uncoordinated and therefore unaware of each other. A Kafka sink will only write to one partition at a time (unless you use a custom interceptor to generate a random partition key header), and indeed it will write to this partition for 10 minutes and then choose another partition to which to write. As such, to maximize the number of events that can be written in parallel, you need to aim to have enough sinks to ensure that all of your Kafka broker disks are being written to in parallel. At small numbers, the laws of probability mean that you are likely to end up with multiple sinks writing to the same partition, or at least the same disk on the Kafka brokers. Whilst we observed that the maximum theoretical output of a Kafka sink is around 120,000 events per second, to push that figure higher you need some multiple of the number of partitions to ensure that writes are spread fairly evenly across them.
Figure 2 – Assignment of sinks to partitions
Number of Kafka Sources (Consumers)
There is a non-obvious relationship between the number of Kafka sources required and the number of producers and partitions. Unlike Kafka producers, Kafka consumers are coordinated so long as they are in the same consumer group. The goal is to take a reasonable endeavors approach to ensure we’re as close as possible to exactly-once delivery semantics. (In practice, we see occasional duplicate messages, but never any drops.) The consumers all register themselves with Apache ZooKeeper and are assigned partitions using the Range algorithm. When the number of consumers c is greater than the number of partitions p, we see undesirable behavior where c – p consumers will actually sit idle–without an allocated partition from which to consume. Only when c is less than p do we ensure that all Kafka sources are used.
We benchmarked Kafka sources in Flume as being able to process up to 260,000 events per second (batch size=8,000), but this rate decreases slightly when a source is reading from more than one partition.

Figure 3 – Too many sinks causing sinks to be idle
As discussed previously, to avoid a collision problem, the number of Kafka sinks should be higher than the number of Kafka partitions. In Figure 4, you can see an example where four sinks have left one partition unused and hence one Kafka source is unable to consume any events. If unbalanced, this situation can lead to the number of used sources becoming a bottleneck (rather than the actual number of sources).

Figure 4 – An unbalanced configuration with sources becoming idle due to sink:partition clashes
Number of HDFS Sinks
HDFS sinks are really quite powerful with respect to bucketing and time-windowing; however, this advantage appears to come at the expense of raw throughput. In testing we observed HDFS sinks writing a maximum of 30,000 events per second, and therefore to achieve high throughput, it’s necessary to have many sinks per Flume agent/channel. We also observed that having more than 8-10 sinks per agent lead to no further increases in write performance. Adding Flume agents to those hosts increased performance, as did adding hosts to the cluster.
Kafka Sinks and Sources vs Kafka Channels
One of the surprising things about Flume is that an agent only needs either a source or a sink (connected to a channel). The thing about the Kafka channel (which is backed by a Kafka topic) is that although you can then use it in place of a sink or source, the downside is that it becomes harder to scale using channels than it does using sinks and sources.
We benchmarked the maximum throughput of a Kafka channel at 120,000 events per second. To add further throughput, we would need to add more channels—however, because a syslog source can only write events to one channel, we would need more syslog sources. This approach is undesirable as we don’t want to add a load balancer into the mix. With the Kafka channel, each batch is written to a different partition (in effect each transaction uses a different Kafka producer), so it avoids the partition hot-spotting problems observed in Kafka sinks.
For the consuming side of the channel, each sink attached to the Kafka channel runs in its own thread and therefore has its own Kafka consumer. Where you need to scale the HDFS sinks up (see below) you then end up with the same problems where c > p.

Figure 5 – Unbalanced configuration using Kafka channels
In Figure 5, the topology is going to be bottlenecked on the write capacity of the four HDFS sinks, with the fifth HDFS sink being unused due to there being only four partitions.
We found that it is significantly harder to achieve a balanced configuration, and hence high throughput, using Kafka channels. Therefore, we elected to deploy Kafka sources and sinks where we can independently tune the number of each on both tiers, trading against a potential loss of data from the memory channel if a Flume agent fails.
Balanced Configuration
In this topology, a balanced configuration is one which has:
- Enough HDFS sinks to handle the output from the Kafka tier
- A number of Kafka sources fewer than or equal to the number of partitions
- Sufficient number of partitions that the sources are not the bottleneck, and also that all disks in the Kafka cluster are utilized
- Enough Kafka sinks such that we have a good probability of not leaving one or more partitions, and hence sources, idle
In practice, finding the sweet spot requires some empirical evaluation; however, using the knowledge above we can get to within a reasonable range for the optimal settings, as illustrated below.
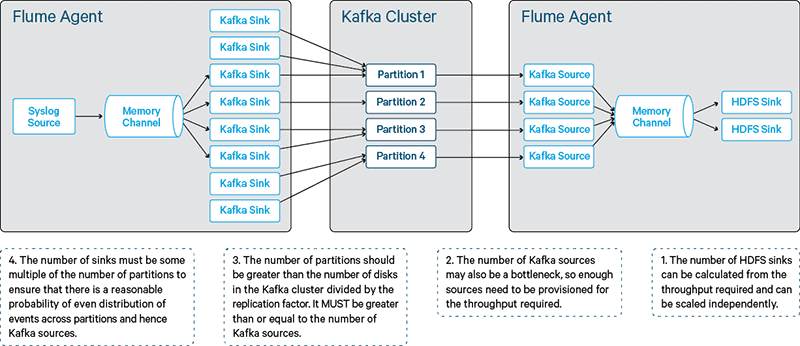
Figure 6 – Balanced Flume-Kafka configuration
Networking
Replication in Kafka works by sending segment replicas from the broker that is the partition leader to those that are the partition followers. This traffic, of course, adds to the overall network consumption on the Kafka brokers. For each message sent to Kafka, there will the corresponding read (from the consumer) and also the corresponding write to the replica (assuming you measure end-to-end performance)–meaning that (at replication-factor = 2), each put of x bytes on the receive side of the broker NIC results in 2x bytes on the transmit side of the broker NIC. Beware of Kafka benchmarks that do not have reads happening at the same time as the writes!
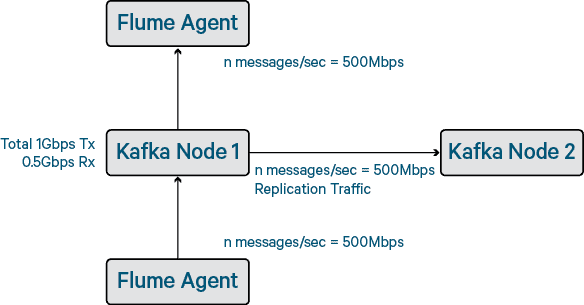
Figure 7 – Impact of network traffic on end-to-end traffic
In our tests, we observed that on a three-node cluster with 1Gbps networking (and 200-byte message size), the total end-to-end throughput cannot go much higher than 550,000 events per second regardless of the number of partitions or disks. We also observed that if the network becomes completely saturated, Kafka can struggle to communicate between the brokers and then erroneously un-elect brokers from partitions. Kafka is topic oriented, not queue oriented, and therefore there is no concept of back-pressure. Because the write-side is disconnected from the read-side, the consumers can become starved of network resource—meaning that you can write greater than 550,000 events per second but the read throughput drops off.
Benchmarking
Using the knowledge above, we were able to put together some ranges for the correct numbers of partitions, sinks, sources, and agents; however, testing the permutations became quite laborious. To get around this issue, we used the Cloudera Manager API along with some simple Python scripting to stop the Flume agents, generate the flume.conf files dynamically, deploy to the cluster, and restart Flume – all without any human intervention. We could then query the performance using the tsquery API and either export to CSV for analysis or correlate timestamps in the Cloudera Manager user interface.
Using some custom dashboards with tsquery, we can very quickly visualize our results and the impact of configuration changes as shown in Figure 8.
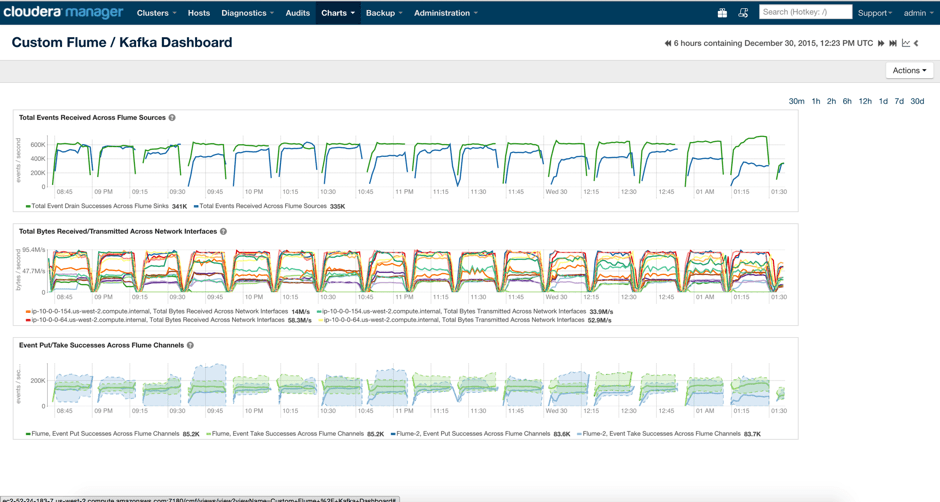
Figure 8 – Example Cloudera Manager dashboard
Results
Using a three-node Kafka cluster with two Flume agents generating syslog events, and two Flume agents consuming and writing to HDFS, we were able to achieve 550,000 end-to-end events per second using 1Gbps networking. When we moved to 10Gbps networking, we were able to achieve over 1 million end-to-end events per second, with reasonable expectation that we could scale out even further by adding more Kafka brokers and Flume agents.
Conclusion
As you have learned above, Vodafone UK has built a geographically distributed ingestion pipeline that with careful tuning can ingest upward of 1 million events per second. But even more important, it now also has a SIEM system running on an enterprise data hub that supports multiple types of analytic processing, all on the same data at the same time.
Tristan Stevens is a Solutions Architect at Cloudera.
Chris Horrocks is a Technical Security Authority at Vodafone UK.


