For a user-facing system like Apache Impala, bad performance and downtime can have serious negative impacts on your business. Given the complexity of the system and all the moving parts, troubleshooting can be time-consuming and overwhelming.
In this blog post series, we are going to show how the charts and metrics on Cloudera Manager (CM) can help troubleshoot Impala performance issues. They can also help to monitor the system to predict and prevent future outages.
CM provides a comprehensive suite of time-series and pre-aggregated metrics and charts at varying levels of granularity to ease the pain of diagnosing and troubleshooting CDH. With so many metrics available today, it becomes imperative to know which metrics to look at, and when and how to look at them.
In this blog post, we cover the various CM metrics for monitoring and troubleshooting specific issues with Impala metadata. Observing trends and outliers in these metrics helps identify concerning behavior and implement best practices proactively. The next post will cover metrics pertaining to ImpalaD processes, the roles of coordinators and executors and highlight OS/system hardware-level monitoring. This helps identify possible hotspots and troubleshoot query performance.
Custom Dashboard in CM
To get started with a custom dashboard, go to Charts → Create Dashboard and enter a name for the dashboard. Then either use the default or set the duration you want it to cover. You can then add charts to the dashboard based on the metrics you’d like to view. To learn more about building dashboards, please visit here.
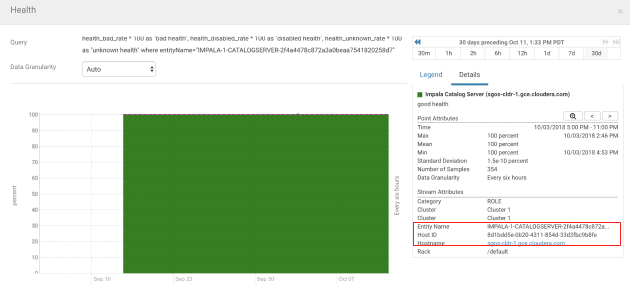
CM also provides the capability to import tsqueries in JSON format—a file for all the below charts can be found here. You are required to replace the entity name placeholders with entity names and/or host IDs. The entity name or host ID can be found using any of the charts on the status page of the service component.
An example:
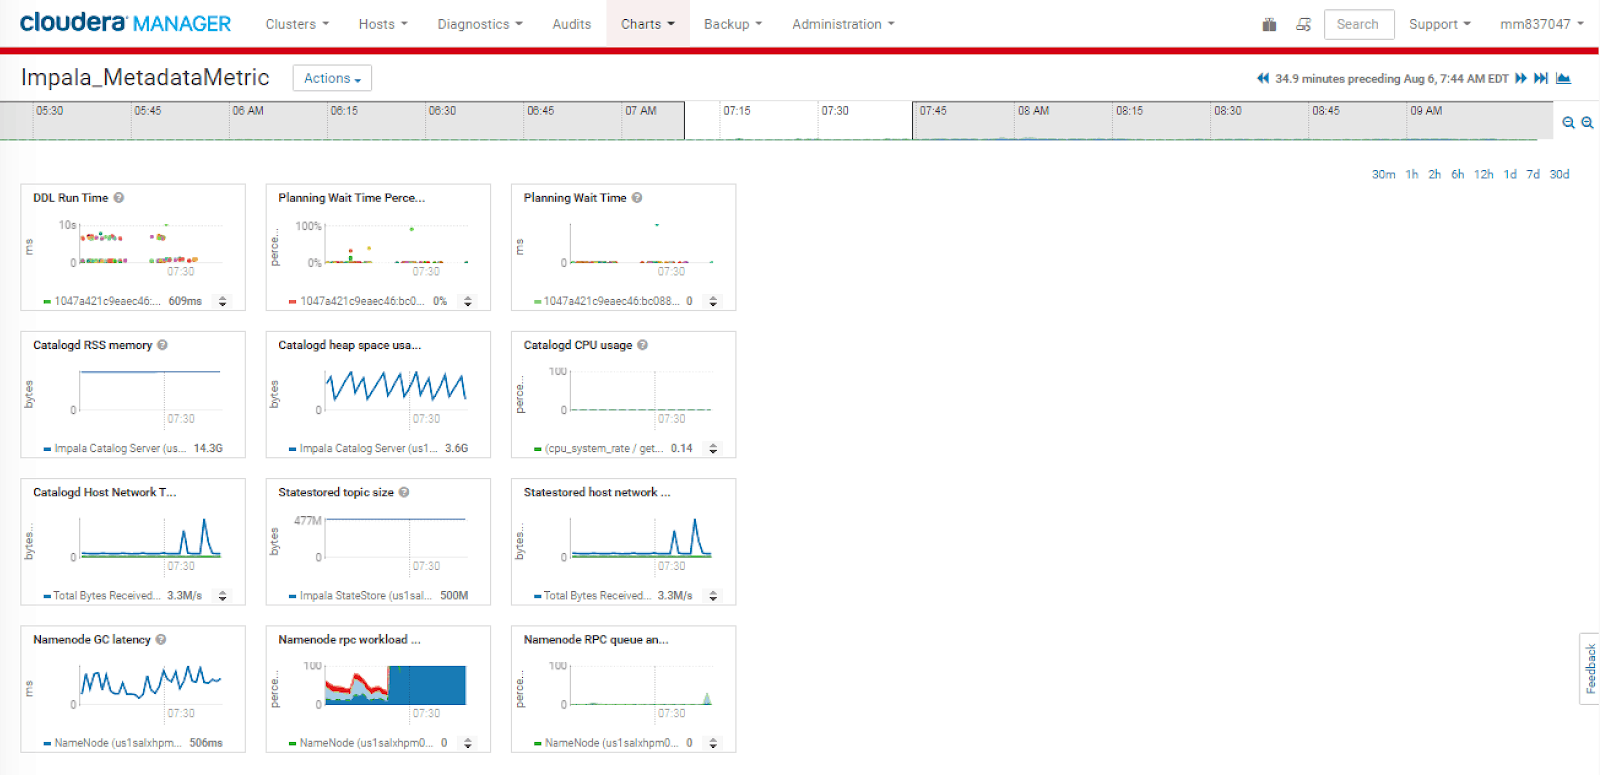
The customized dashboard from the tsqueries look similar to this:
Unraveling the Metadata Load
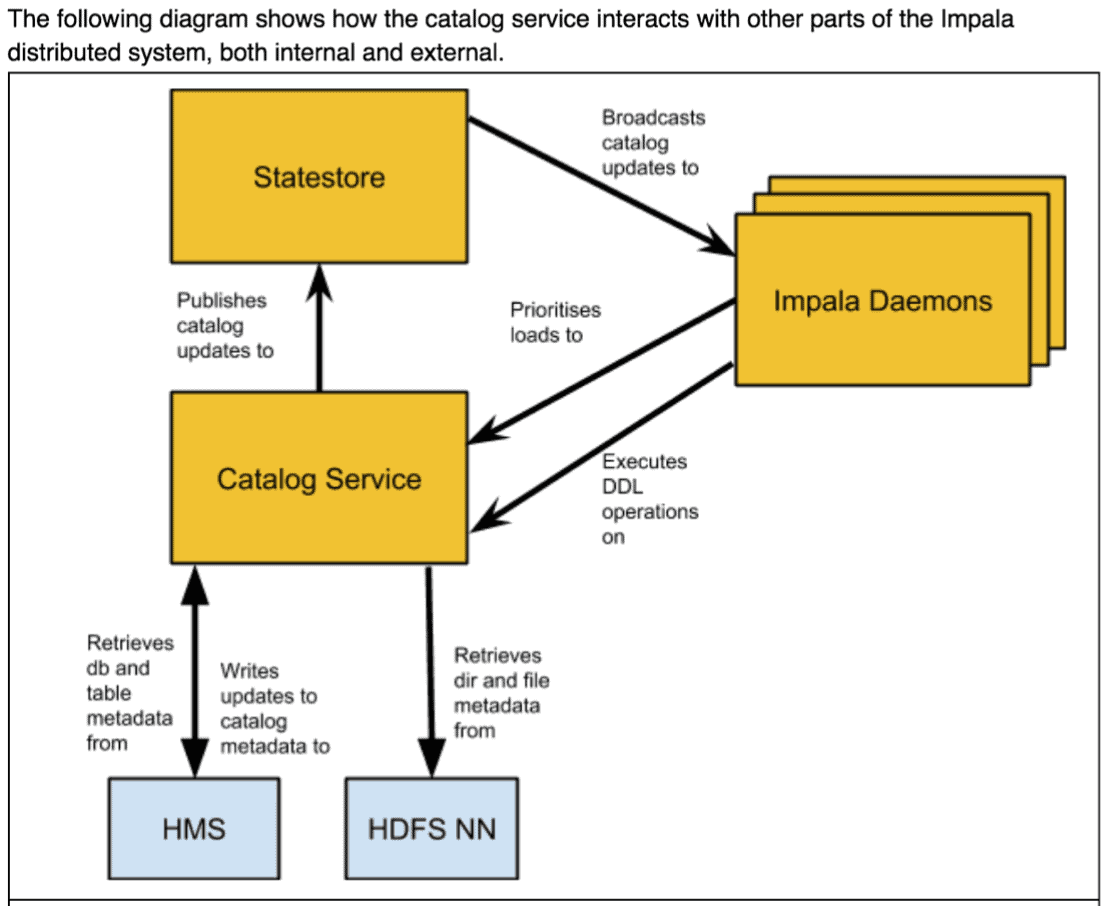
Impala caches metadata for speed. The caching mechanism requires loading metadata from persistent stores, like Hive MetaStore, NameNode, and Sentry by CatalogD. This is subsequently compressed and sent to the Statestore to be broadcast to dedicated coordinators. Such a complex system is easily subject to numerous bottlenecks which make it imperative to monitor the key relationships among Impala’s components.
The following diagram shows how the catalog and statestore service interacts with other parts of Impala’s distributed system, both internal and external.
While most metadata operations are lightweight or trivial and thus have little to no impact on performance, there are a number of situations in which metadata operations can negatively affect performance. These “metadata workload anti-patterns,” can negatively affect the performance as data, users, and applications scale up. They may cause scalability snags. This makes it necessary to monitor the metadata growth rate, identify anti-patterns, and take preventative measures to ensure smooth functioning.
Some of the top anti-patterns are listed below:
- Computing incremental stats on wide (large number of columns) partitioned tables
- Large number of partitions/files/blocks[2] (click here for more information)
- Constantly and frequent REFRESH of large tables
- Indiscriminate use of INVALIDATE METADATA commands
- High number of concurrent DDL operations[3]
- Catalog or Statestore service restarts
- High number of coordinator nodes ( > 10% of nodes on a cluster >= 150 nodes)
Slow isn’t Steady
Longer planning wait time and slow DDL statement execution can be an indication of Impala hitting performance issues as a result of metadata load on the system. To identify proactively, you can monitor and study the Planning Wait Time and Planning Wait Time Percentage visualization, which can be imported from Clusters → Impala → Best Practices and the DDL Run time metric, which can be built using the below tsquery:
SELECT query_duration from IMPALA_QUERIES
WHERE service_name = "REPLACE-WITH-IMPALA-SERVICE-NAME"
AND query_type = "DDL"
**Max value for Y range in DDL Run time defaults to 100ms, make sure it’s unset.
Note: The planning wait time is for searching and finding DML commands that are waiting for a metadata update. As one might wonder why DML waits for a metadata update isn’t it that metadata is read from cache making it a fairly quick operation? Well, the fact is that a DML statement can trigger a metadata update request under certain situations like service restart or “INVALIDATE METADATA” metadata operation run before the DML operation.
Identify
These are a few key metrics to identify and troubleshoot metadata specific issues.
Memory
The metadata-specific memory footprint can be tracked, using the following metrics. They, in turn, can help track metadata growth over time and understand variations that can help identify anti-patterns.
- CatalogD RSS memory (optional): Shows how much memory is allocated to CatalogD process and is in RAM. RSS tends to grow with addition of metadata. Once allocated, RSS remains stable, unless the system is restarted.
SELECT mem_rss
WHERE entityName = "REPLACE-WITH-CATALOG_HOSTID"
AND category = role
or
SELECT mem_rss
WHERE serviceName="REPLACE-WITH-IMPALA-SERVICE-NAME"
AND roleType=CATALOGSERVER AND category = ROLE
- CatalogD heap space usage: Indicates the amount of heap space used by CatalogD. This is available from CDH 5.13 onwards. Heap memory usage is a subset of the RSS consumption and primarily used for storing metadata cache, while loading metadata, and while computing stats. Heap tends to surge when system is under a heavy load. CatalogD compacts (if enabled) and serializes the metadata to reduce the network load for propagation to the Statestore, the actual metadata size is reduced to close to ~1/10th of the heap size. As Impala limits a single catalog update to 2GB, with compression enabled, Catalogd heap usage spike beyond ~20GB for a single catalog update can be a fatal, and you might experience service downtime.
SELECT impala_catalogserver_jvm_heap_current_usage_bytes
WHERE entityName = "<catalogd_host_id>"
AND category = role
or
SELECT impala_catalogserver_jvm_heap_current_usage_bytes
WHERE serviceName="REPLACE-WITH-IMPALA-SERVICE-NAME"
AND roleType = "CATALOGSERVER" AND category = ROLE
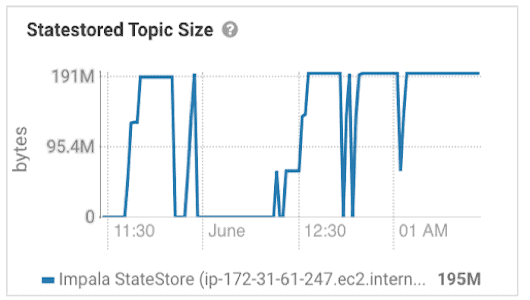
- StatestoreD topic size: Shows the the sum of the size of all keys and all values for all topics tracked by the StateStore. This metric indirectly helps us track memory Statestore topic size is the most accurate to evaluate point-in-time size of compacted metadata.
SELECT statestore_total_topic_size_bytes
WHERE roleType = STATESTORE
AND category = ROLE
The actual metadata topic size after compaction is reflected by StatestoreD topic size metric. StatestoreD metric is very useful for identifying workload patterns. For example, an INVALIDATE METADATA or DROP STATS on a large partitioned table immediately triggers a drop in topic size and easily identifiable while RSS/heap may not have slightest indication of it.
CPU
CPU usage on CatalogD and StatestoreD usually stays low. However, CatalogD requires additional processing power to compact and serialize metadata. CatalogD CPU utilization of 20% or more can be concerning and slow down service operations.
- Catalogd CPU usage: Shows the percentage of CPU utilized by Catalogd.
SELECT cpu_user_rate / getHostFact(numCores, 1) * 100, cpu_system_rate / getHostFact(numCores, 1) * 100
WHERE roleType = "CATALOGSERVER"
Network
Network throughput on the Statestore is a critical metric to monitor, as it is an important indicator of performance and quality of network connection. The Statestore / catalog network is very vulnerable to the above “anti-patterns.” That, in turn, has a snowball effect on the cluster. Having a large number of hosts act as coordinators can cause unnecessary network overhead, even timeout errors, as each of those hosts communicates with the Statestore daemon for metadata updates.
As Impala requires the propagation of the entire table metadata with each catalog update, frequent metadata operations like REFRESH on large tables increase the host network throughput. Occasional spikes due to service restarts or the impalad service going down can be ignored. It’s highly recommended to colocate the Catalog and Statestore on the same host to reduce network load. They should not be colocated them with other network intensive services such as Namenode.
- CatalogD/StatestoreD host network throughput (host-level): Shows the quantity of data, in bytes, send in and out of the host where the Statestore and Catalog server processes reside[1]
SELECT total_bytes_receive_rate_across_network_interfaces, total_bytes_transmit_rate_across_network_interfaces
WHERE hostName="<STATESTORE_HOST_NAME>"
Note: Catalog server and Statestore are usually co-located on the same node, but should they be on separate nodes, run the above query against the hostname for each.
Others
CatalogD generally makes RPC calls to Namenode to fetch the file block location and file permission information. It is hard to track down the RPC call per service but generally a high RPC load can slow down Impala metadata fetches. As GC latency could drastically impact RPC, it would be prudent to monitor it.
- Namenode RPC workload summary
SELECT get_block_locations_rate, get_file_info_rate, get_listing_rate
WHERE roleType = "NAMENODE"
- Namenode RPC queue and processing time
SELECT rpc_processing_time_avg_time, rpc_queue_time_avg_time
WHERE roleType = "NAMENODE"
- Namenode GC latency
SELECT integral(jvm_gc_time_ms_rate)
WHERE roleType=NAMENODE AND category = ROLE
Don’t forget to configure the above for both primary and secondary Name Node. Besides the foundational pillars of memory, processing and network consumption, that make up the building blocks of a distributed service such as Impala, checking dependent systems especially the NameNode and HiveMetastore can be helpful. However, detailed interpretation of those above metrics will be out of scope for this blog post. Although, there is no specific key metric to monitor HMS, an overall health check is recommended.
Troubleshooting Scenarios:
Below are some common scenarios to assess the aforementioned charts to infer possible mitigative measures.
Scenario 1
Description: For a specific time period, a few metadata-dependent queries exhibit slowness, and you observe spikes in Catalog RSS memory, Catalog heap usage as well as Statestore topic size.
Possible Inferences:
- With load_in_background disabled, table(s) are refreshed or accessed for the first time after a service restart
- Incremental stats performed on a table having huge number of partitions and many columns, adds approximately 400 bytes of metadata per column, per partition leading to significant memory overhead
- Might indicate presence of small files
- Presence of high number of concurrent DDL operations
Actions:
- Avoid restarting Catalog or Statestore frequently
- Reduce metadata topic size related to the number of partitions/files/blocks
- Avoid compute incremental stats[4] on large partitioned tables
- Reduce the DDL concurrency
Scenario 2
Description: Workload experiencing metadata propagation delays and you observe spikes StatestoreD/CatalogD Network throughput and slight or no change on Catalog RSS memory and heap usage
Possible Inferences:
- As RSS and heap usage is stable and unchanged, there is no drastic change in catalog update but the workload may be performing frequent refreshes on large tables.
- Impala service restarts or Impala daemons went down
Actions: Avoid frequent refresh of large tables and heavy concurrency of DDL operations. Employ alternate mechanism for querying fast data. Ensure Statestored is not co-located with other network intensive services on your cluster. Use of dedicated coordinators can reduce the network load. Correlating with TCP retransmissions and dropped packet errors could help in determining if the performance issue is network-related.
Scenario 3
Description: Inconsistent DDL run times and you observe Statestored topic size falls and rise up to the previous state.
Possible Inferences:
- Indicates occurence of DDLs operations that drop metadata followed by queries fetching the dropped metadata plus new additional metadata for example operation like below:
- Occurence of DROP STATS followed by COMPUTE INCREMENTAL STATS on one or more table
- Occurence of INVALIDATE METADATA on tables followed by immediate SELECT or REFRESH on same tables
Actions: INVALIDATE METADATA usage should be limited.
Scenario 4
Description: Statestored topic size drops to the initial state and you observe all queries run after the drop is slow and eventually returns to normal once the topic size is restored
Possible Inferences:
- A service restart has occurred
- A Global INVALIDATE METADATA was triggered
Actions: Avoid full service, and catalog and statestored restarts if not necessary. Avoid global or database-level INVALIDATE METADATA, restrict it to table level and perform it only when necessary.
Scenario 5
Description: Statestored topic size growing at a fast rate associated with high network throughput and Impala query performance deteriorating every day
Possible Inferences:
- Too many new partitions and files added to tables too fast.
Actions: Switch to a tool designed to handle rapidly ingested data like Kudu, HBase, etc.
Scenario 6
Description: Queries exhibiting slowness and you observe high Catalog CPU usage (>20%)
Possible Inferences:
- More the catalog update size more the processing power needed to serialize and compact. Indicates occurrence of large # of parallel refresh on large tables with small files and incremental stats can incur considerable CPU overhead.
Actions: Reduce DDL concurrency. Decrease overall memory footprint for catalog update.
Quick Summary
| CatalogD RSS memory | CatalogD heap space usage | StatestoreD topic size (zoom in, if necessary) | Catalogd CPU usage | CatalogD/ StatestoreD host network throughput (host-level) | Namenode RPC workload summary (RPC calls per sec) | |
| Safe range | < 80% of total process memory allocation | < 80% of total or sudden spike beyond 20 GB | – | < 20% | Few Mbs to 2 Gbs per second | 30-40K/s |
| Metadata workload anti-pattern | ||||||
| Compute incremental stats on large wide partitioned tables | increases | increases | increases | low | med | n/a |
| Large # of databases, tables, partitions and small files growing at a fast rate | increases drastically | increases drastically | increases drastically | med | med | high |
| Frequently refreshing large tables(table or partition) | stable | stable | stable or increases slightly | low | very high | stable |
| Indiscriminate use of INVALIDATE METADATA commands | stable | stable | drops momentarily and rises again | med | very high | high |
| High number of concurrent DDL operations | increases drastically | increases drastically | increases drastically (> 2 GB) | high (> 20%) | very high | high |
| Catalog or statestore service restarts | drops drastically & rises | drops drastically and rises | drops drastically and rises | medium | high | stable |
| High number of coordinator nodes | n/a | n/a | n/a | n/a | very high | n/a |
Conclusion
In this post, we explored several key Cloudera Manager metrics which monitor and diagnose possible metadata specific performance issues in Apache Impala. When troubleshooting a complex distributed service such as Impala, it is important to establish solid foundation to monitor the critical components and their interaction within the architecture. Understanding the relationship between memory and processing power in the running processes and observing outlier behavior helps us forge a clearer path for diagnostics and drill down to a root cause. Although the Statestore and Catalog daemon are not critical to the actual uptime of the Impala service, they possess invaluable information to ensure the smooth functioning of the service.
Stay tuned for part 2!
References
[1] Cloudera Manager only provides network throughput metric per host and not per service. Metric can be hard to interpret and correlate if we have other services hosted on the server
[2] Estimating metadata size
Raw size = #tables * 5KB + #partitions * 2kb + cols * 100B + #files * 750B + #file_blocks * 300B
+ 400MB * cols * partitions (for incremental stats)
Compacted size = ~1/10th of Raw size
[3] The metadata catalog update parallelism is limited by num_metadata_loading_threads, which defaults to 16, and lack of throttling mechanism for DDL, heavy concurrency can overload CatalogD and degrade overall performance.
[4] As an alternative to Compute incremental, either switch to compute stats(full) with TABLESAMPLE (CDH 5.15 / Impala 2.12 and higher) or manual stats using alter table or provide external hints in queries using the tables to circumvent the impact of missing stats.
Mansi Maharana is a Senior Solutions Architect at Cloudera.
Suhita Goswami is a Solutions Consultant at Cloudera.


