


In this blog we will take you through a persona-based data adventure, with short demos attached, to show you the A-Z data worker workflow expedited and made easier through self-service, seamless integration, and cloud-native technologies. You will learn all the parts of Cloudera’s Data Platform that together will accelerate your everyday Data Worker tasks. This demo-guided blog aims to inspire further curiosity and learning, as well as fuel a fruitful, interactive dialogue – we welcome you to reach out to us if any particular part piques your interest.
Assumptions
In our data adventure we assume the following:
- The company has previously created a business unit tenant in CDP Public Cloud
- There is an environment available on either Azure or AWS, using the company AWS account – note: in this blog, all examples are in AWS.
- The SDX layer is configured and the users have appropriate access
- Company data exists in the data lake
- Data Catalog profilers have been run on existing databases in the Data Lake
- A Cloudera Machine Learning Workspace exists
- A Cloudera Data Warehouse virtual warehouse with Cloudera Data Visualisation enabled exists
- A Cloudera Data Engineering service exists
The Data Scientist
Our data adventure starts with Shaun, a Data Scientist at a global bank. He has recently attended a Cloudera Fast Forward webinar where the latest trends and production-proven ML algorithms have been highlighted and exemplified. He downloads the Cloudera Fast Forward report about modeling Telco Churn and after reading it, his interest is piqued. Shaun plans to clone the exemplified model linked from the report to his local environment. He is particularly excited about model interpretability: Refractor and desires to experiment with this project on his own.
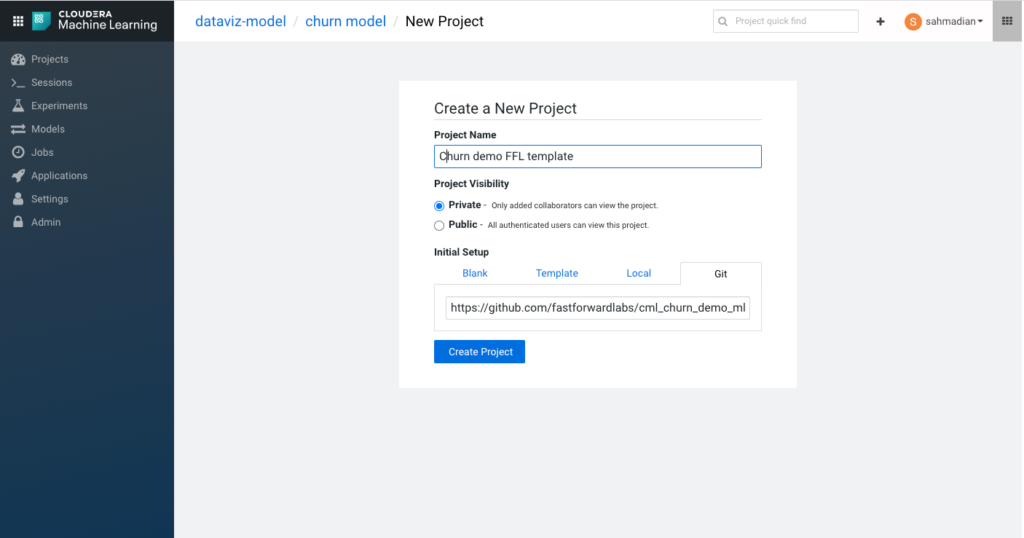
Ready to start experimenting, he logs in to his CDP ML workspace. ML workspaces are fully containerized with Kubernetes, enabling easy, self-service set up of new projects with access to granular data and a scalable ML framework that gives him access to both CPU and GPUs. He can bootstrap his project from existing template projects or even sync with a GitHub repository like the Churn Demo from FastForward Labs. This exactly what he wants: compute resources, automatic project setup, and security & connection to the environment without any IT intervention. A few clicks and he’s up and running with his project.
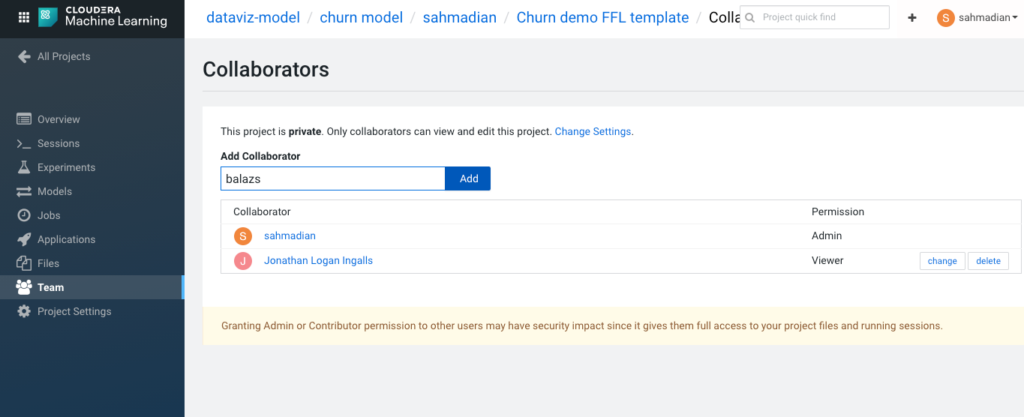
The “Team” feature allows him to add other users and members to his project to allow full project collaboration.
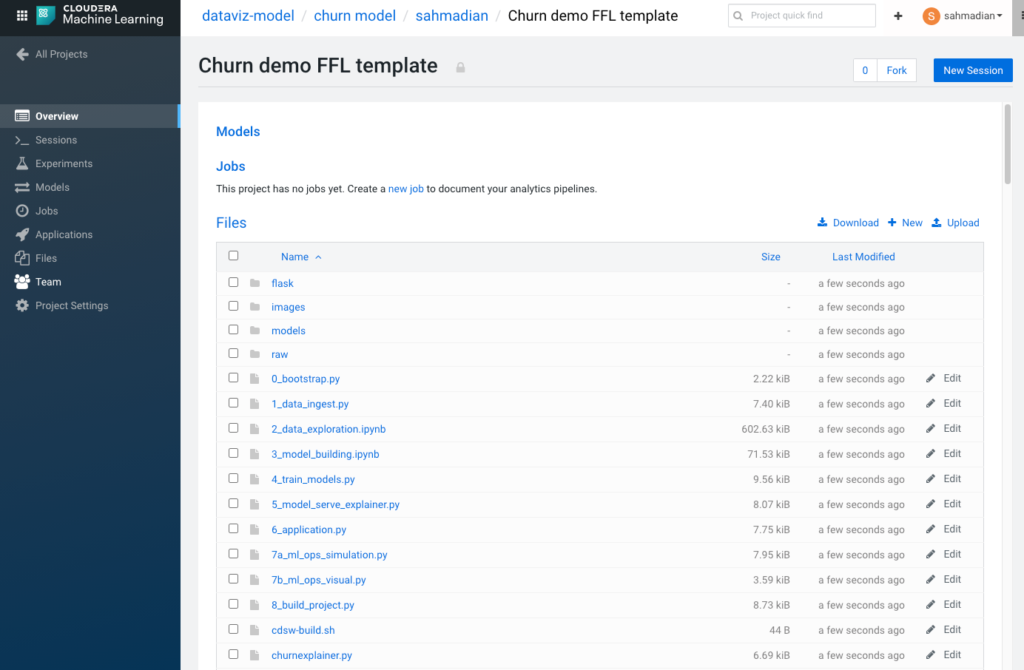
He now has the FFL churn example loaded to start learning the various capabilities. The project is broken up into a series of steps each representing the different phases of a typical ML project:
- Data setup
- Exploration & discovery
- Model building
- Model training
- Model deployment & serving
- Creating custom application
- Model operations & monitoring
What’s nice about the FFL project is that it helps Shaun explore the concept of model interpretability and applies it to real use-case around customer churn that he can then dissect at his own pace and then apply the concept to his own project.
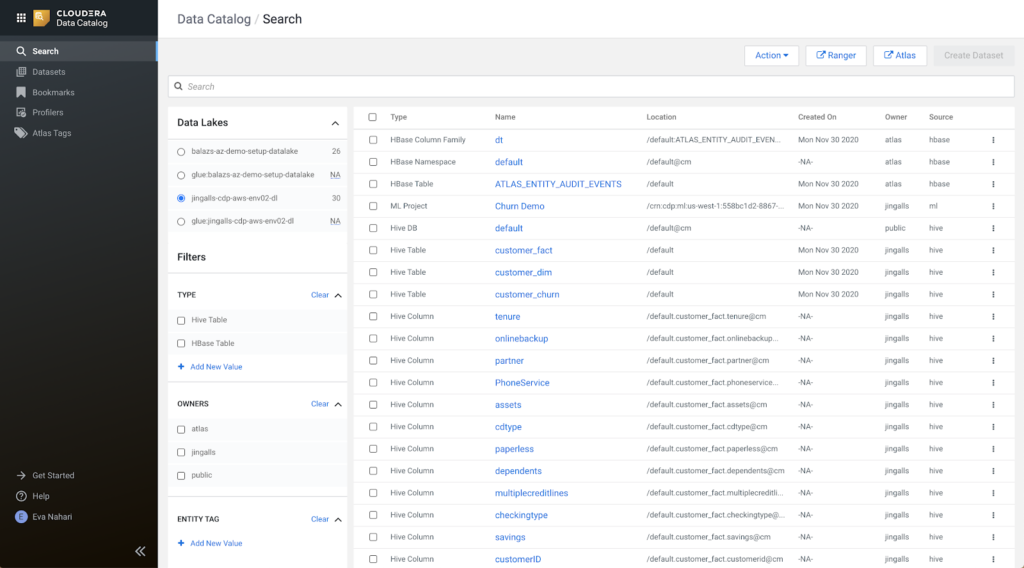
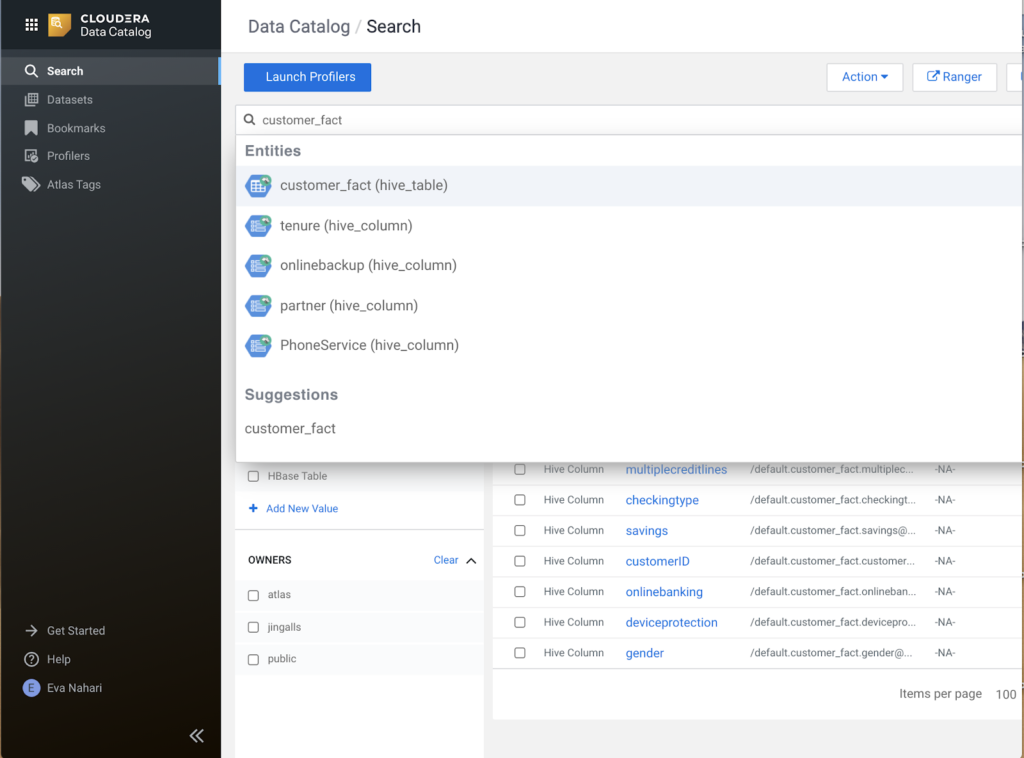
Next, Shaun wants to build a similar model, but for the bank where he works and over the bank’s own customer data. He starts with browsing the available tables in the Data Catalog tool in CDP. He seeks to quickly discover and learn about available data sets.
He then realizes that some tables he needs to use for this project exist, but he does not have the read permissions on them. The data is tagged as sensitive data, e.g. “financial”, and the owner field showing “retail banking” instantly informs Shaun which organization to reach out to to ask for access. Shaun opens a ticket that lands with Eva, who is a Data Steward in the team that manages the retail banking data, and asks if he could be allowed temporary access to customer data tables for this experiment.
The Data Steward
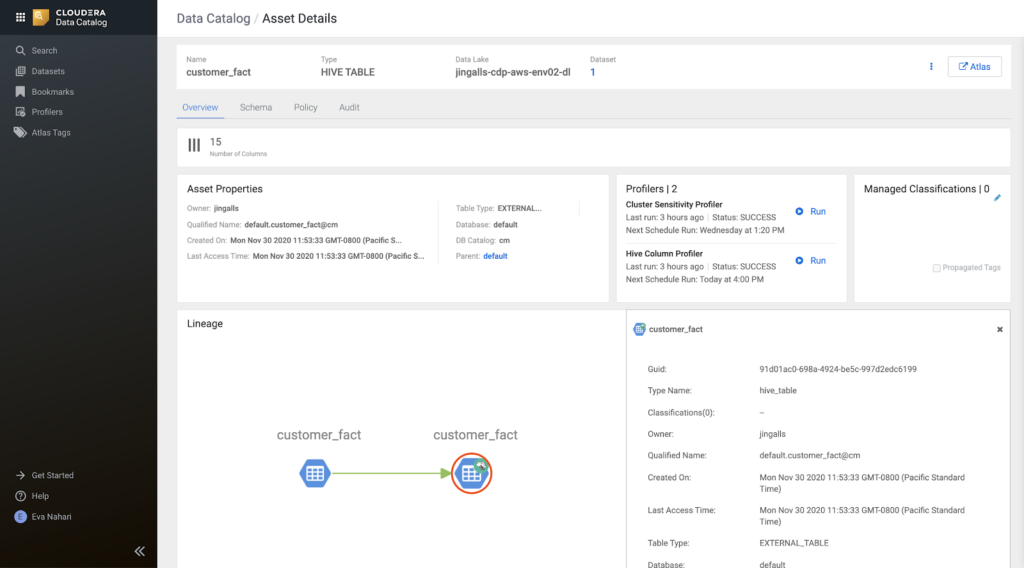
Eva quickly looks up the tables in the Data Catalog, searching on the “financial” tag to more quickly navigate to the data category and investigate the restrictions associated with it.
For each table, she first views the lineage, to understand which source data is entailed and takes a quick look at the classifications and tags.
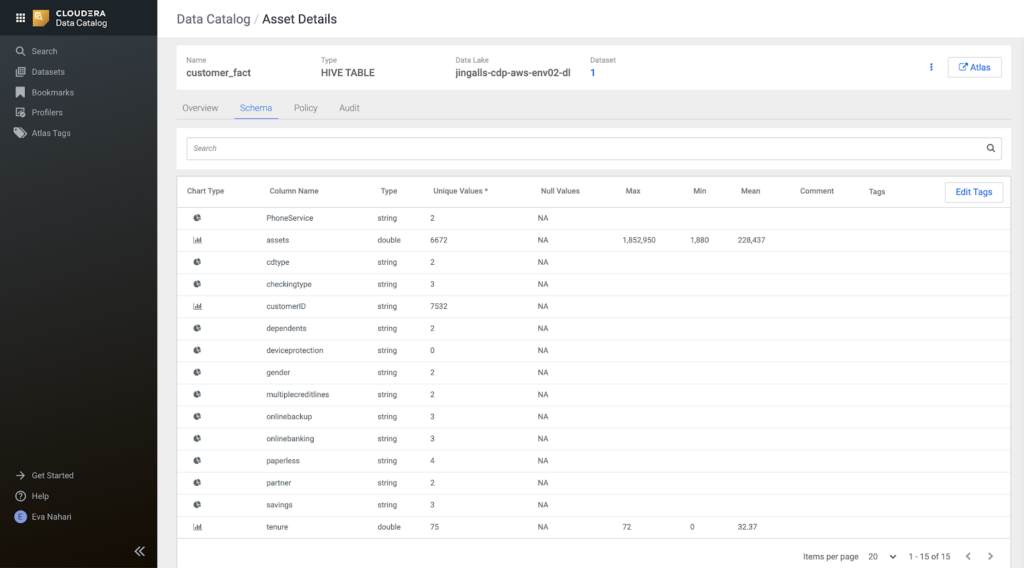
Then she moves on to the schema view, to validate the profiler stats to get some idea of the shape of the data as well as introspect what columns are available in the tables. From the profiler stats the data looks ok and not skewed in any direction. However, one thing that sticks out from a security perspective is the customerID column.
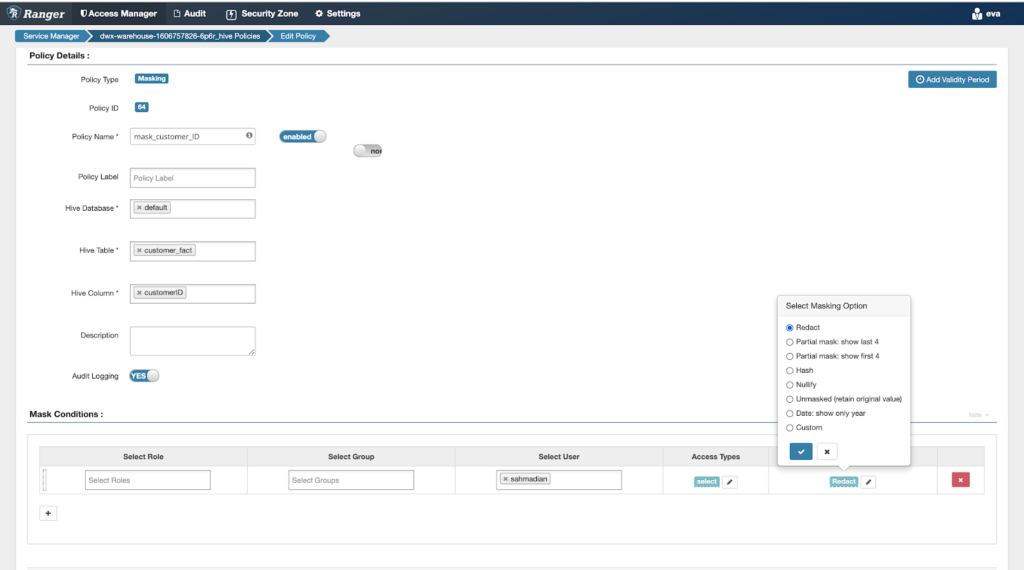
Eva goes into the data access policies view, to grant access to Shaun for both tables.
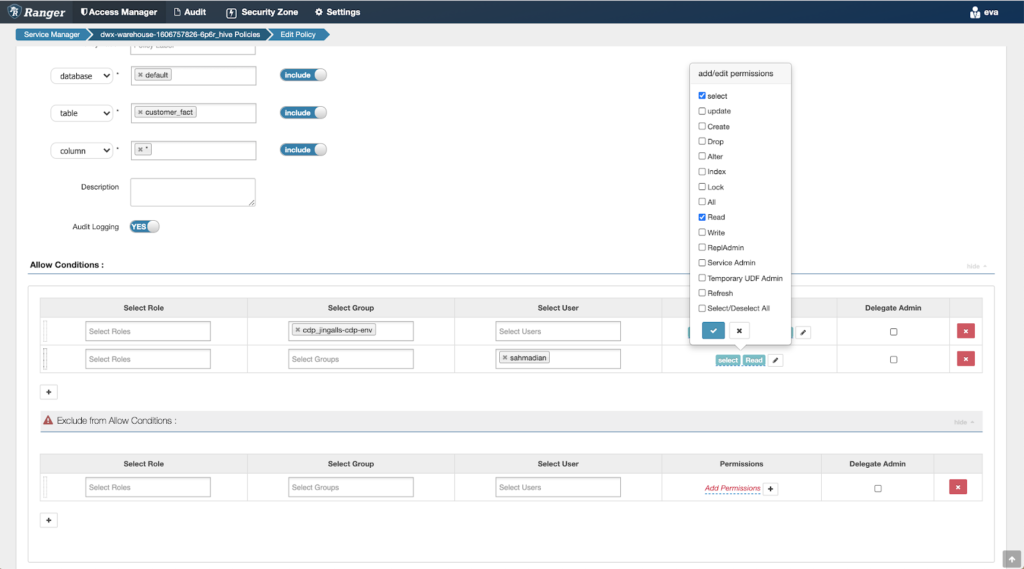
Then she modifies the masking policy to redact the customer ID column.
This takes about a total of 2-3 minutes and she can manage all data access and lineage across environments in a central place. An increasingly important capability she is thankful for, as more and more deployments pop up across multiple cloud environments – private or public – which would otherwise make her job much more difficult.
She quickly sends back a slack message to Shaun that all is green light and he is ready to go, once the updates and validations are done. Which enables Shaun to move forward almost immediately.
Shaun validates he has access to the data, then continues with the exploration of this dataset for the experiment.
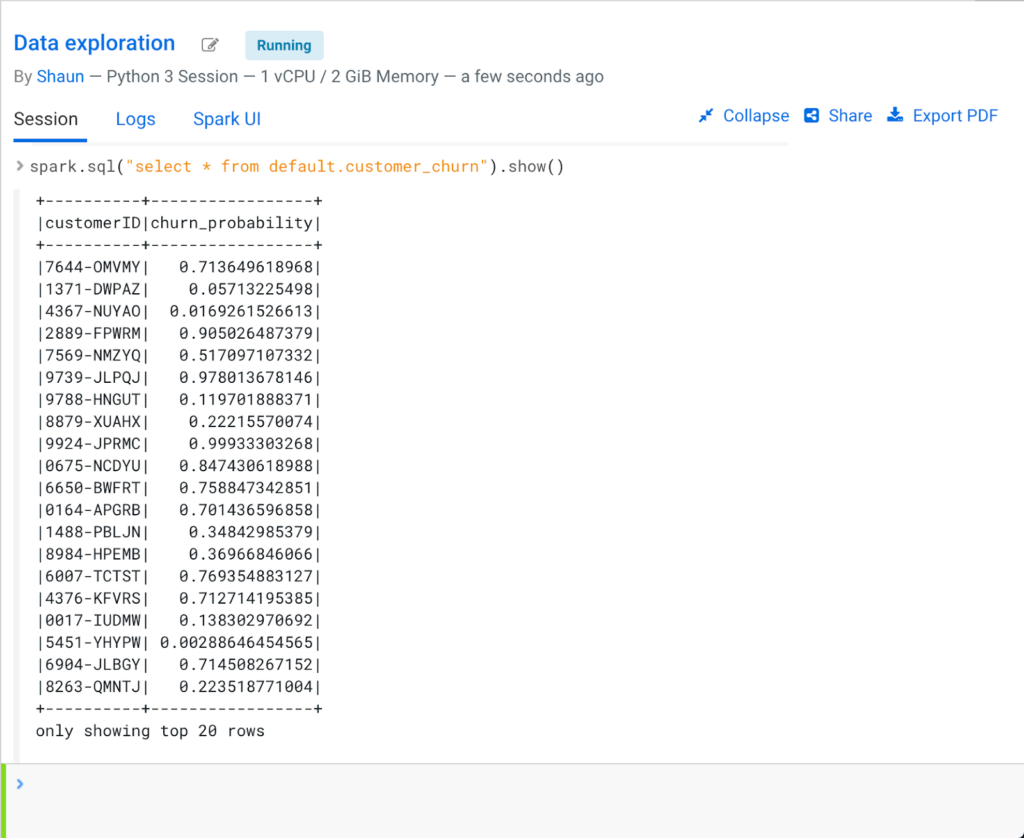
Some time later, he has successfully built a customized churn model, based on the company’s own data. Here we see the results in the form of a table:
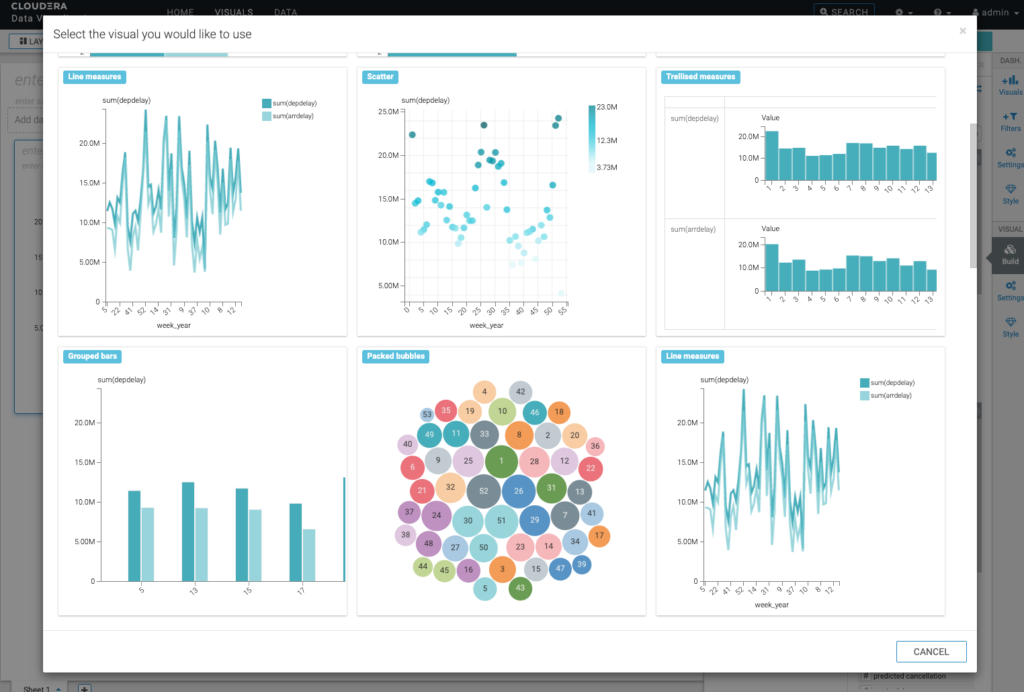
Shaun decides to quickly pull up Data Visualization from within CML, to build some initial visualizations, with the aim to better communicate the results to others in the organization.
The Data Analyst
A week or so later, a request lands on Jon’s desk, who is an Analyst at the same bank. The request entails to build a more rich dashboard with the new data set available from the recent Data Scientist organizations’ churn experiment. The dashboard should serve the purpose of customer insights for the wider organization and needs some polish and enrichments. Jon concludes that the old customer dashboard needs to be augmented with this new data set, and then sets out with the idea to build a Customer Insight application using the out-of-the-box, easy-to-use visualization tool in CDP: Data Visualization. The existing dashboard will need to incorporate the new data set Shaun created and will require additional enrichments and polish. But this is a piece of cake with Data Visualization, as you can easily add new visuals – even against different backends in CDP.
Jon starts with an existing Virtual Warehouse in CDP’s Data Warehouse service, that has access to the shared Database Catalog, where Shaun’s result table exists. This Virtual Warehouse currently has no active query requests.
Virtual Warehouse is in a Running state but is not servicing any active query requests. Therefore, it has dynamically scaled down

He continues on by opening the Data Visualization user interface in the drop down menu of the Virtual Warehouse.
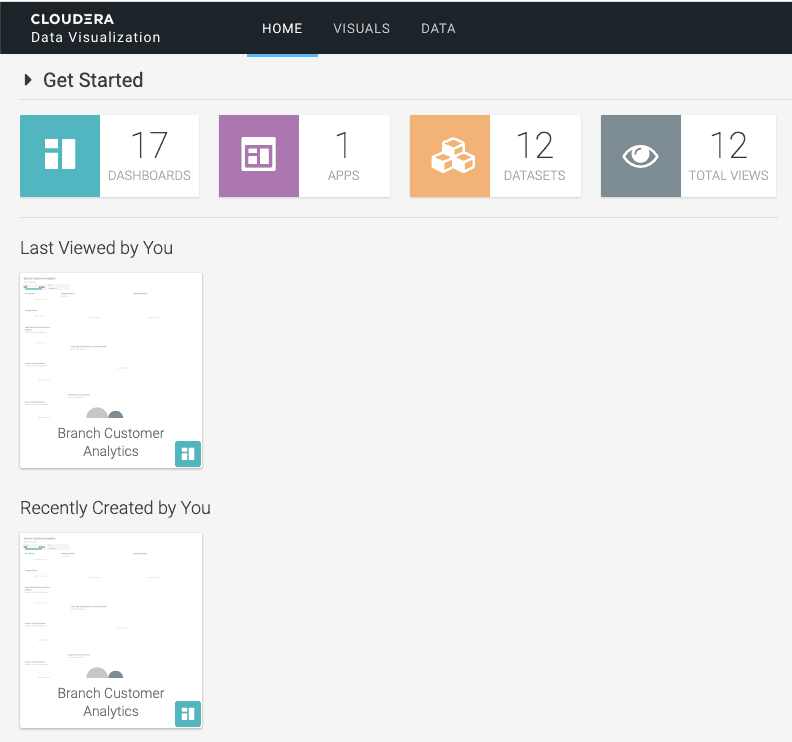
Jon finds the existing Dashboard and selects it, to view the dashboard contents.
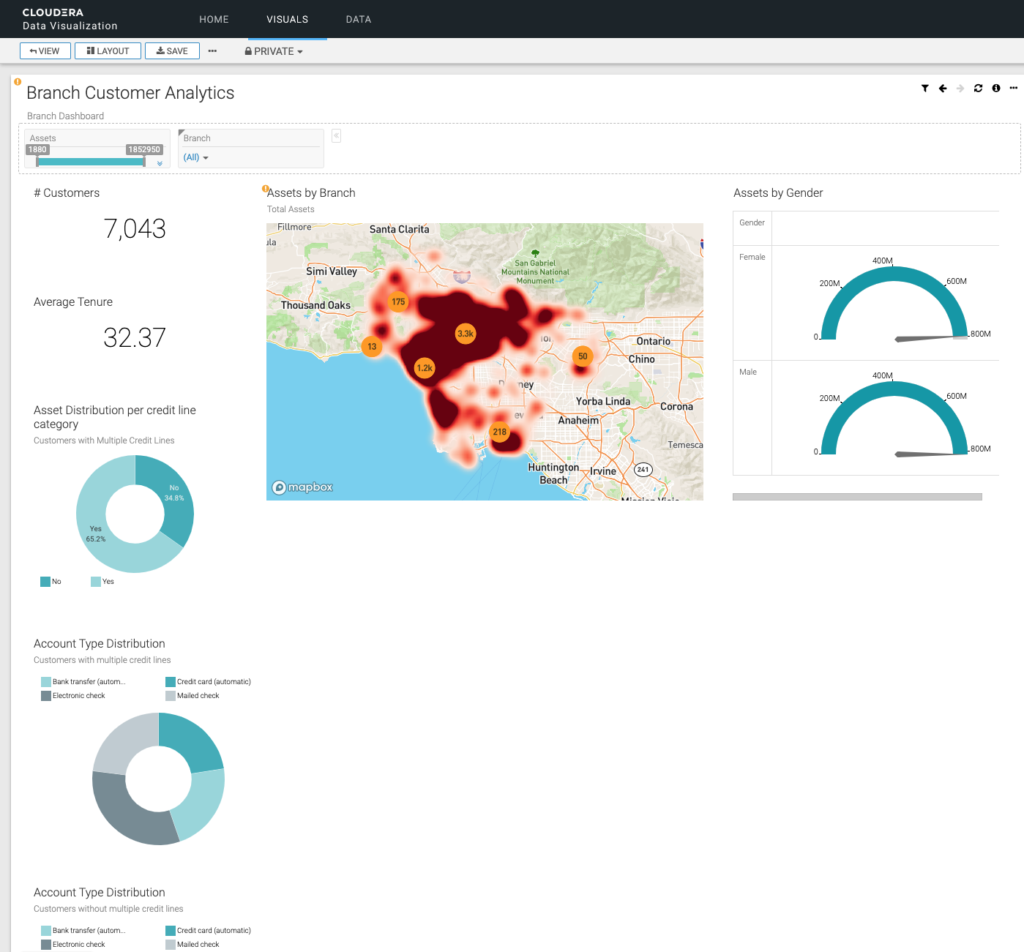
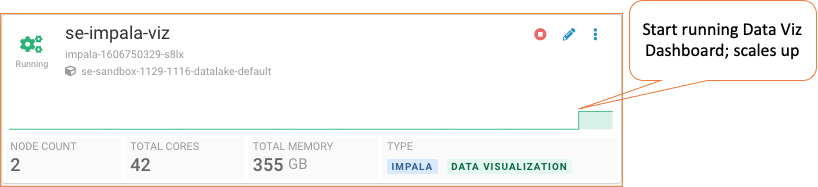
Once this dashboard opens, it starts sending queries back to the Virtual Warehouse, and the Virtual Warehouse auto-resumes and dynamically scales up to start processing the queries at the capacity needed. The auto-suspend and auto-resume capabilities is one of the key reasons the Bank has chosen CDP, so they only consume resources when needed, yet instantly, to save costs while meeting SLAs and temporary scale out needs seamlessly.
Virtual Warehouse is in a Running state but is not servicing any active query requests. Therefore, it has dynamically scaled down
He then needs to modify the underlying Data Model to add the newly created Churn experiment data.
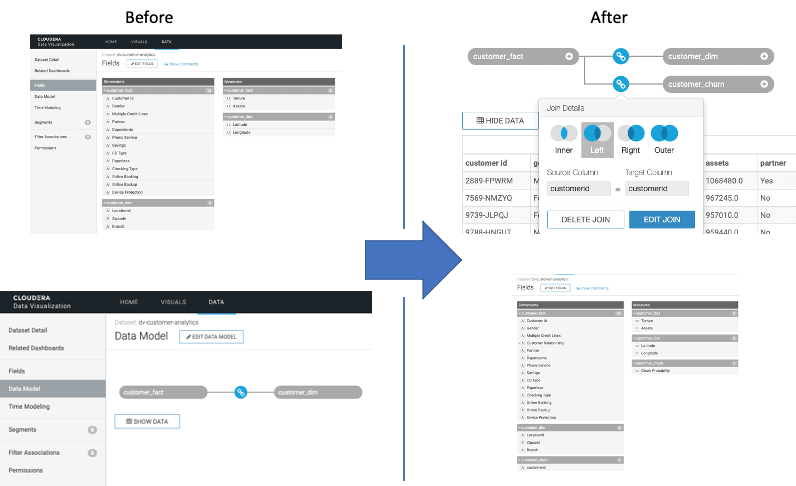
Once the Data Model has included the new churn data, Jon returns to the old customer dashboard to begin augmenting it with the new data. After just a short time, he has the updated dashboard up and running and can start sharing it with others.
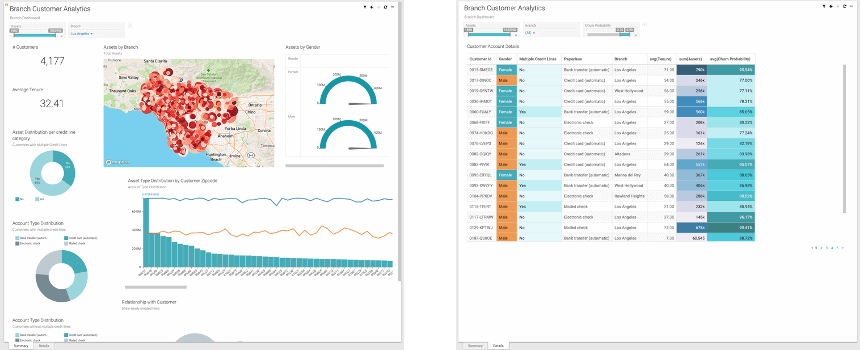
Jon quickly shares the updated dashboard with the Marketing group by moving it to their Data Visualization workspace through a simple click of the MOVE button. This makes the Dashboard instantly available to all users/groups who have access to their group’s workspace so they can within just a few minutes start to consume the new data and data insights.
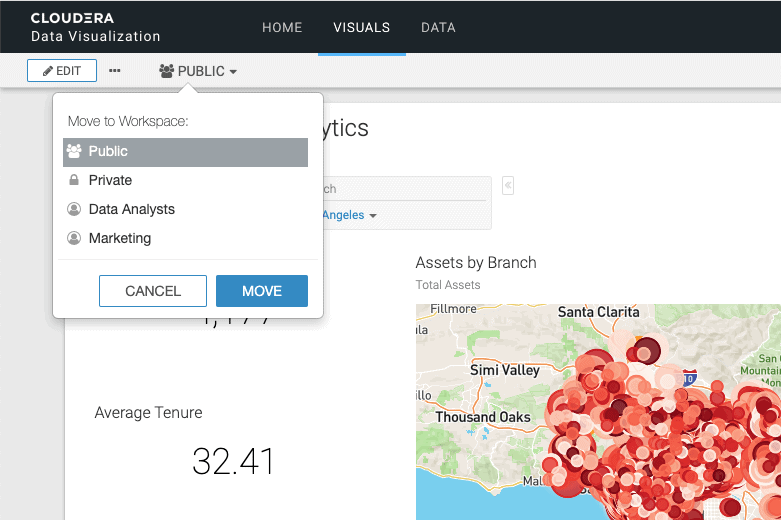
Cloudera Data Visualization allows easy augmentation as the business needs change, and a common “language” for data users across the organization to use. The business gets immediate access in a few minutes after data has become available and to any new data asked for, and the business can thereby get to results faster.
The Data Engineer
Time passes by and the dashboard is getting very popular. The virtual schema the Data Scientist Shaun created for the ad-hoc experiment is not very effective with the growing traffic. A request to the production team is opened and Karthik, a Data Engineer on that team, quickly finds that he needs to change the structure of the Data Mart. Meaning he needs to optimize the schema of the underlying data, as there are now 100s of users accessing the dashboard.
Karthik takes a quick look at the Data Warehouse queries generated by the dashboard in the Workload Manager tool in CDP.
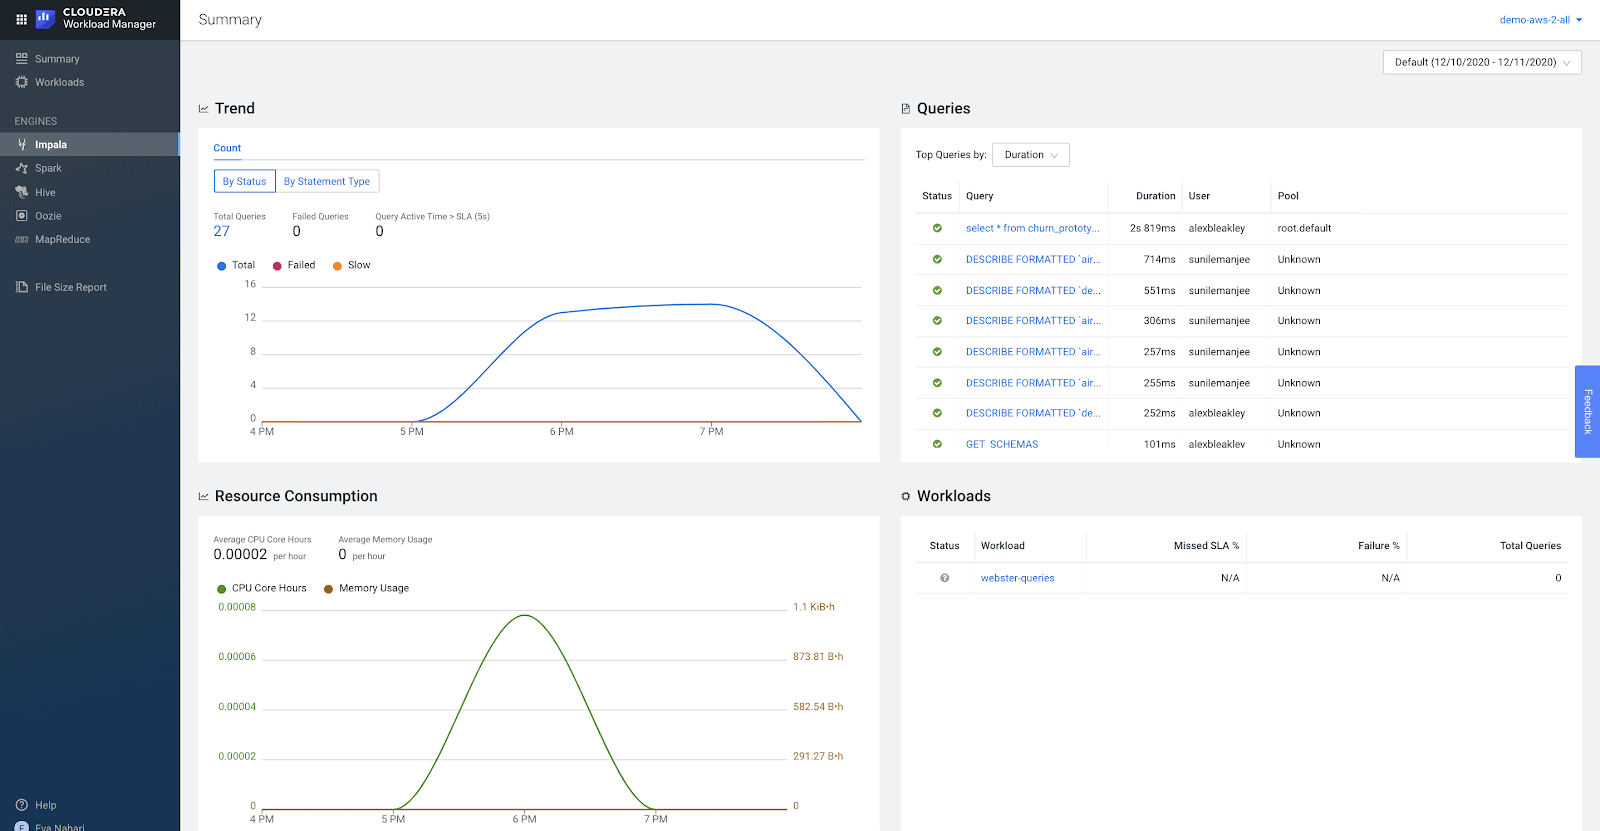
The KPI is 0.5 sec, and the tool quickly helps Karthik to the right queries to investigate by highlighting the queries which don’t meet the SLA. After quick introspection he makes the decision to materialize the joins for the queries failing the SLA, to make them more efficient.
He creates a one-line Spark SQL job that reads the results of the joins into a flat table and makes sure to schedule it to refresh every hour.
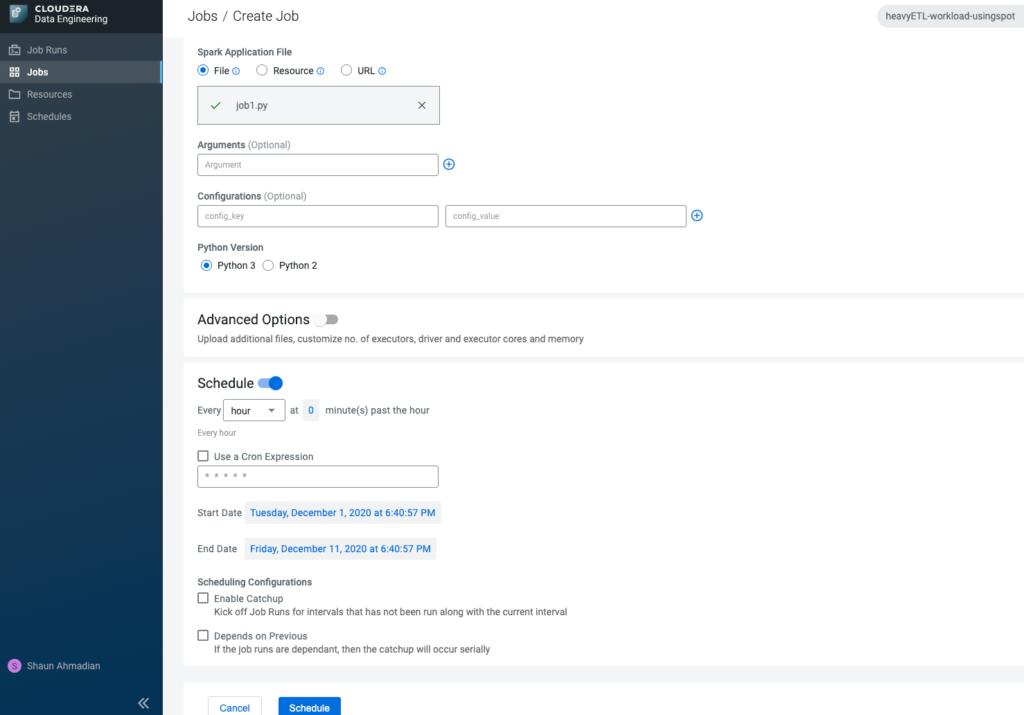
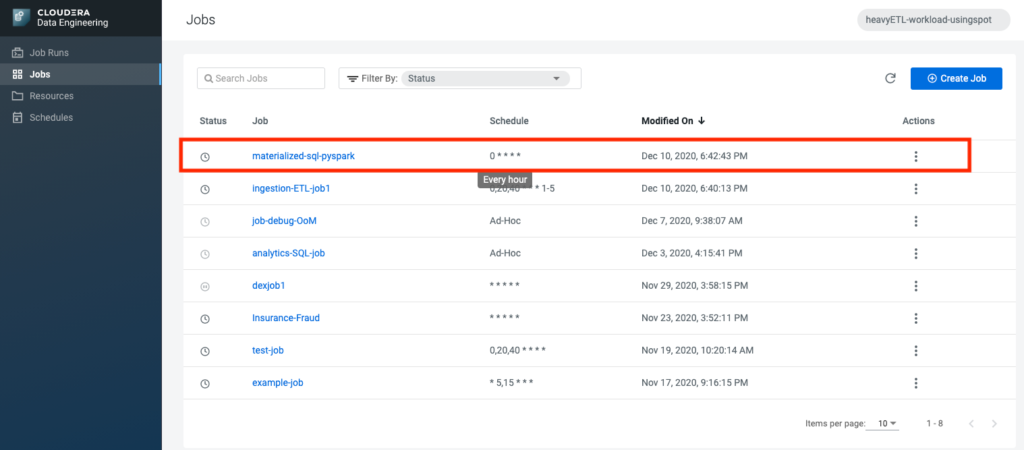
CDE: Job scheduled for run every hour
In a matter of minutes, he has figured out how to optimize and launched it to be regularly run via CDE in CDP.
Conclusions
Cloudera’s data platform serves a unified security model across data and multiple workloads so that IT organizations can serve all of their line of business – be it data scientists, data engineers, or business analysts – faster and with more ease. Clouder helps accelerate organizations through its multi-use hybrid and multi- cloud-optimized data platform that serves cross-organization workloads and data insight needs faster time.
This blog has taken you through a persona-based journey that modern data organizations have already adopted or are on a journey to adopt. These organizations have chosen to partner with Cloudera to support, guide, and accelerate them to:
- Manage a quickly growing multi-workload environment with ease
- While meeting increasing demands on SLAs and cost-efficiency through the service of intelligent tooling and services
- Navigate hybrid and multi-cloud environments with increased control
- Protecting their data and business while allowing more self-serve and access
If you are intrigued to start the journey of transforming and accelerating your data strategy to a more self-serve driven and flexible modern data cloud architecture, then your data journey starts here.
Editor's Choice


Nice article, thanks!
I was wondering though – once Karthik materialised the joins (in a new table I assume) will that help without repointing Jon’s model? Is there any query rewrite feature that works not on materialised views, but on results of a Spark job? Or something like modeling an aggregate/prejoin table in Data Visualisation?
cheers,
Maciek