HBase Customers upgrading to CDH 6 from CDH 5, will also get an HBase upgrade moving from HBase1 to HBase2. Performance is an important aspect customers consider. We measured performance of CDH 5 HBase1 vs CDH 6 HBase2 using YCSB workloads to understand the performance implications of the upgrade on customers doing in-place upgrades (no changes to hardware).
About YCSB
For our testing we used the Yahoo! Cloud Serving Benchmark (YCSB). YCSB is an open-source specification and program suite for evaluating retrieval and maintenance capabilities of computer programs. It is often used to compare relative performance of NoSQL database management systems.
The original benchmark was developed by workers in the research division of Yahoo! who released it in 2010.
More info on YCSB at https://github.com/brianfrankcooper/YCSB
In our test environment YCSB @1TB data scale was used, and run workloads included YCSB default workloads and customized workloads.
YCSB test workloads used:
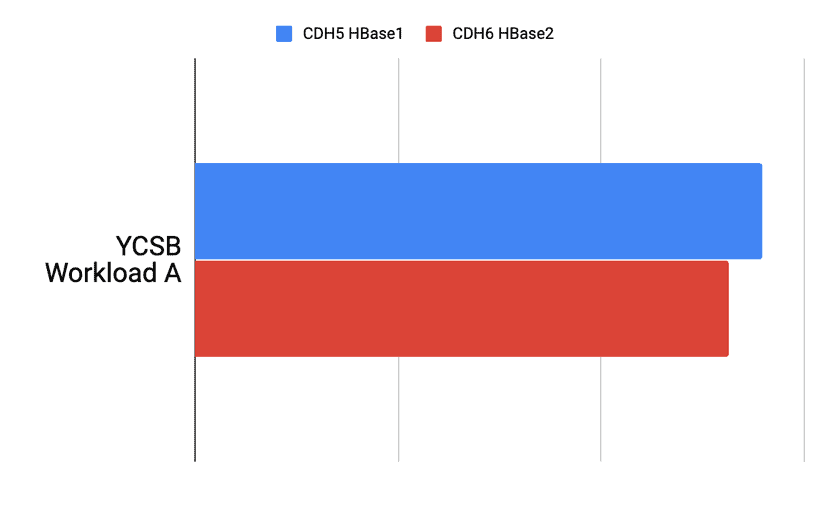
- Workload A (Read+Update) : Application example: Session store recording recent actions in a user session
- 50% READ
- 50% UPDATE
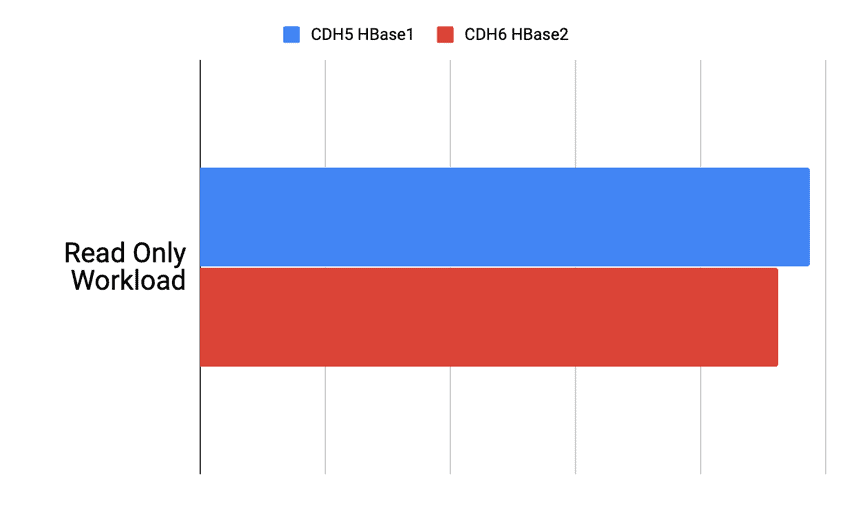
- Workload C (Read Only) : Application example: Read user profile cache, where profiles are constructed elsewhere (e.g., Hadoop)
- 100% READ
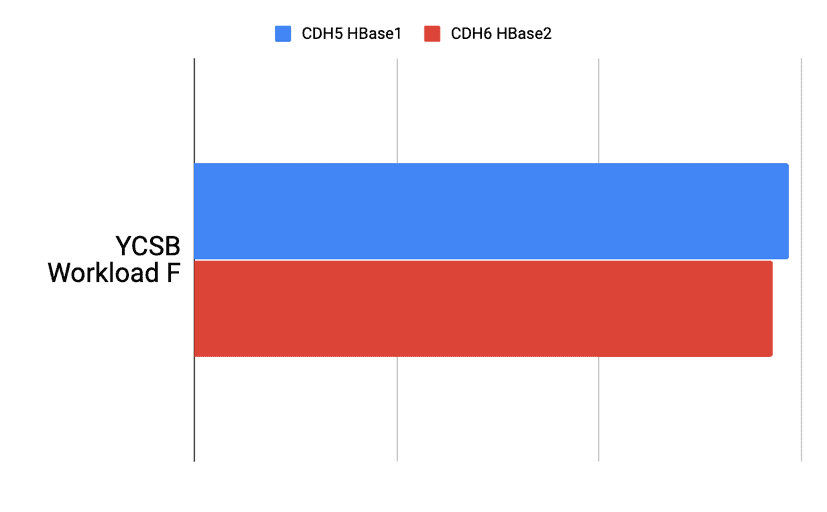
- Workload F (Read+Modify+Write) : Application Example: User database, where user records are read and modified by the user or to record user activity
- 50% READ
- 25% UPDATE
- 25% READ-MODIFY-WRITE
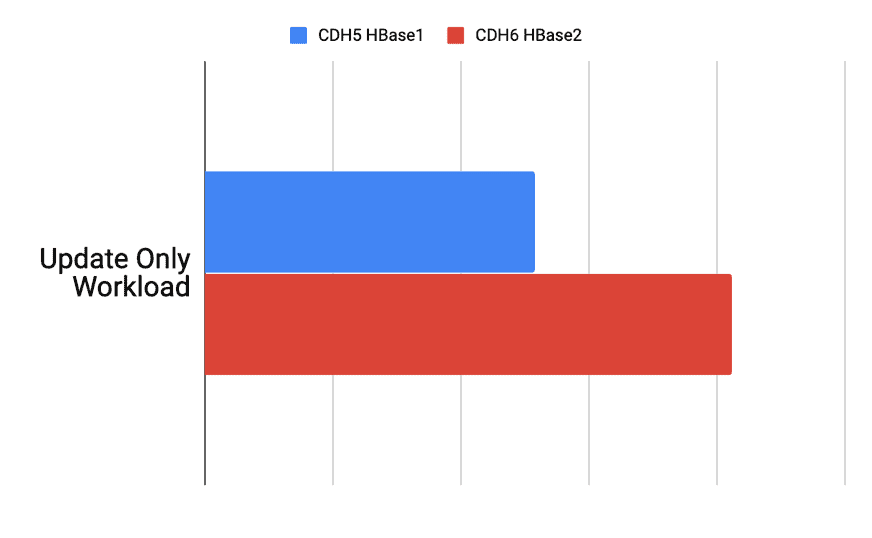
- Cloudera custom YCSB workload Update Only : Application example: Bulk updates
- 100% UPDATE operations
More info on YCSB workloads at https://github.com/brianfrankcooper/YCSB/wiki/Core-Workloads
Test Methodology
We are loading the YCSB dataset with 1000,000,000 records with each record 1KB in size, creating total 1TB of data. After loading, we wait for all compaction operations to finish before starting workload test. Each workload tested was run 3 times for 15min each and the throughput* measured. The average number is taken from 3 tests to produce the final number.
*Throughput (ops/sec) = No. of operations per second
Throughput comparison of CDH5 HBase1 vs CDH6 HBase2 using YCSB
Custom Update Only Throughput
Update Only. Use cases: Bulk updates
CDH6 HBase2 throughput 50% more than CDH5 HBase1

YCSB Workload A Throughput
Update heavy. Use cases: Session store, recording recent actions
CDH6 HBase2 throughput 6% less than CDH5 with HBase1

YCSB Workload C Throughput
Read Only. Use cases: User profile cache, newsfeed cache
CDH6 HBase2 throughput 5% less than CDH5 HBase1

YCSB Workload F Throughput
Read-Modify-Write. Use cases: Activity store, user databases
CDH6 HBase2 throughput very close to CDH5 HBase1
Test Results Summary
Custom Update Only workload: HBase2 CDH6 Update Only workload performed 50% better than HBase1 CDH5
YCSB Workload F workload: CDH6 YCSB Workload F workload operations and throughput was very similar to CDH5 HBase1
YCSB Workload A and YCSB Workload C workloads: CDH6 YCSB Workload C Read Only and YCSB Workload A had approx 5% less operations and throughput than CDH5 HBase1
CDH versions Compared
CDH6 Version: Cloudera Enterprise 6.2
CDH5 Version: Cloudera Enterprise 5.16.2
Java VM Name: Java HotSpot(TM) 64-Bit Server VM
Java Version: 1.8.0_141
Test Environment
Cluster used : 6 node cluster
Node Description: Dell PowerEdge R430, 20c/40t Xenon e5-2630 v4 @ 2.2Ghz, 128GB Ram, 4-2TB disks
Test Setup
- YCSB Version: 0.14.0
- YCSB Binding Version hbase20
- YCSB table @1TB scale
- WAL configs
- Per-RegionServer Number of WAL Pipelines (wal.regiongrouping.numgroups) set to 1
- Multi-WAL: wal.provider set to Multiple HDFS WAL
- Note -> Here Single WAL used as WAL pipelines is set to 1
- Asyncfs WAL: region.replica.replication.enabled set to false
- Security: None configured (No Kerberos)
- Region servers
- Number of Regions in the YCSB table 250, with 5+1 node cluster its approx 50 regions per region server
- Average Region server size 290G
- Data per region ~ 6G
- Only L1 cache with LruBlockCache used with 3 GB cache size limit
Based on our testing (results above), customers looking to upgrade from CDH 5.x to 6.x should expect significantly improved performance for bulk updates and fairly similar performance for other workloads as compared to what they are getting today.
Learn more about Cloudera Operational DB here


>Average Region server size 290G
>Only L1 cache with LruBlockCache used with 3 GB cache size limit
For a read heavy/read only work load seems very low cache usage. Any results u have with more cache hits possibly? (Considering we have optimized off heap cache possibility in 2.0)
Please add graph title, axis titles, axis values and axis units so your graph can represent something, they currently are meaningless.
For example in the first graph blue bar is smaller than red bar, and in the second graph, it’s the opposite, but since we don’t have the information to understand what it describes, we cannot conclude anything.
The graph bars show throughput (ops/sec) = No. of operations per second, as the graph title mentions. The longer the bars the better throughput and performance. For the first graph, blue bar (CDH5) is smaller than the red bar (CDH6) because HBase2 CDH6 (red bar) Update Only workload performed better than HBase1 CDH5 (blue bar). For other YCSB workloads the results were shared in the graphs in a similar way.