

Configuring Apache Solr memory properly is critical for production system stability and performance. It can be hard to find the right balance between competing goals. There are also multiple factors, implicit or explicit, that need to be taken into consideration. This blog talks about some common tasks in memory tuning and guides you through the process to help you understand how to configure Solr memory for a production system.
For simplicity, this blog applies to Solr in Cloudera CDH5.11 running on top of HDFS. The platform is Oracle JDK 8 and 64 bit Linux only. The blog is split into two parts.
Common Tasks in Memory Tuning
Before digging into details, let’s take a look at general problems to solve in memory tuning. To avoid JVM Out-Of-Memory (OOM) or heavy GC overhead, the JVM heap size has to match Solr’s memory requirements. That’s the top task in memory tuning. The setting of JVM heap size is straightforward. It’s set in the Solr configuration (Cloudera Manager->Solr configuration->heap size). Solr’s memory requirements, on the other hand, can vary significantly depending on index size, workload, and configurations. This blog will show you how to make good estimations so that you can match JVM heap size and Solr memory requirement.
Another common task in memory tuning is finding the optimal tradeoff between memory usage and performance. Usually, but not always, the more memory Solr has at its disposal, the better it will perform. On the other hand, the more memory given, the more hardware cost and JVM GC overhead. There is a certain point where performance improvement can no longer justify these downsides if memory given is larger than that point. In this blog, we are going to show you some examples of how to find the sweet spot in choosing the optimal heap size, as well as give you some other general best practices in turning Solr.
JVM GC tuning is also a common task. Solr is in general GC friendly and doesn’t require much fine tuning in most of cases. The blog will cover a couple of most critical GC tuning knobs that could improve Solr performance.
How Solr uses memory
Before we start estimating Solr memory requirement, let’s take a quick look at how Solr uses memory. There are two types of memory Solr can use, heap memory and direct memory ( often called off-heap memory). Direct memory is used to cache blocks read from file system, similar to Linux file system cache. For heap memory, the following diagram shows various major consumers inside Solr.
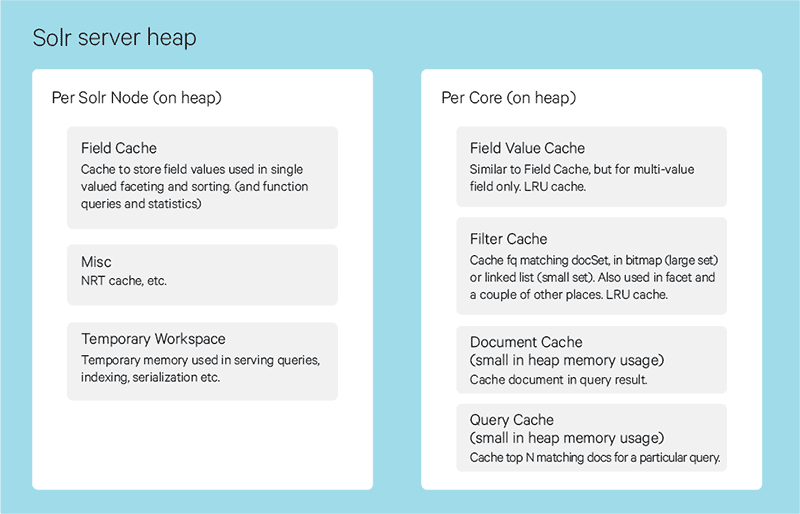
As you can see, a large portion of heap memory is used by multiple caches. Except for field cache, other caches are per core. A Solr core is a slice of index. A Solr server usually has multiple cores. The maximum memory a cache uses is controlled by individual cache size configured in solrconfig.xml.
Get Started
Before tuning, make sure your system is balanced in terms of index size and workload. For example, use shard router or collection alias that can create collections and cores in even size under production workload. Also make sure all cores are spread evenly on all nodes. If you would like to learn more details about balanced design, please keep an eye out for future Cloudera engineering blogs.
Since Solr memory requirement depends on index size and workload, distributing index and workload evenly among all Solr nodes greatly simplifies memory tuning, avoids bottleneck on any single node and eventually helps system stability and performance. The example assumes that index and workload are evenly distributed among all Solr nodes.
As the first step to deploy Solr to production, it’s a good idea to start Solr with a set of ‘safe’ configuration parameters. They may not give best performance. But they make sure Solr is stable in the first place and establish a solid baseline for further tuning. Here are a few tuning knobs to start and some of them will be revisited in the tuning section of blog part 2.
JVM Heap size
As mentioned above, the JVM heap size should match Solr heap requirements, which can be estimated as following.
Solr heap requirement est. = Filter cache size * (total doc in a core/ 8) * num of Cores +
Field value cache memory usage (if used) * num of Cores +
Field cache memory usage (if used) +
Misc memory usage (4G for busy system) +
Temporary workspace (4-6G for busy system)
If cache auto warm is used, replace cache size with cache size + cache autowarm size.
Field cache is a major memory consumer in Solr. The best way to reduce its memory footprint is to avoid it by using docValues. There are more details in the following section. In case field cache is used, as a rough estimation, if the workload is heavy in faceting and sorting for single valued fields and index size is large (>50M documents or > 10G in size), use 8-12G for field cache memory. Otherwise 4-8G is ok. Field value cache is used for faceting and sorting for multi-valued fields and follows similar guidance as field cache.
The JVM heap size needs to match Solr heap requirement estimation plus some buffers. Ideally 30% buffer space is good for a production system. This gives room to accommodate sporadic memory usage spike, such as background merging or occasional expensive queries, and allows JVM to perform GC efficiently. For a production system, the minimum size of heap recommended is 16G once you add them up.
Direct Memory
Solr uses direct memory to cache data read from disks, mostly index, to improve performance. Direct memory doesn’t cause any JVM GC overhead. Direct memory size can be set using CM (Cloudera Manager->Solr configuration->direct memory). As rule of thumb, the minimum size of direct memory recommended is 8G for a production system if docValues is not used in schema and 12-16G if docValues is used. A related configuration is block cache slab count (Cloudera Manager->Solr configuration->slab count) which needs to match direct memory size.
Slab count = direct memory size * 0.7 / 128M
Garbage Collector
For Oracle JDK 8, both CMS and G1 GC are supported. As rule of thumb, if the heap size is less than 28G, CMS works well. Otherwise G1 is a better choice. If you choose G1, there are more details about G1 configuration in the part 2 of this blog. You can also find helpful guidance in Oracle’s G1 tuning guide.
Meanwhile it’s always a good idea to enable GC logging. The overhead of GC logging is trivial but it gives us a better understanding how the JVM uses memory under the hood. This information is essential in GC troubleshooting. Here is an example of GC logging settings.
-XX:+PrintGCTimeStamps -XX:+PrintGCDateStamps -XX:+PrintGCDetails -XX:+PrintTenuringDistribution -XX:+PrintAdaptiveSizePolicy -XX:+PrintGCApplicationStoppedTime -XX:+PrintReferenceGC -Xloggc:/var/log/solr/solr_gc.log
In the example above, GC log is stored at /var/log/solr/solr_gc.log. You can point it to any other path. Since Solr is running under Linux user ‘solr’ in CDH, just make sure Linux user ‘solr’ has write permission to the path you point.
Schema
If your workload is heavy in facet and sorting in some fields, use docValues for these fields. Using docValues Solr can avoid using field cache and field value cache on the heap, which can greatly reduce memory pressure on heap and JVM GC. On the other hand, docValue fields can result in more disk I/O which impact performance and requires large direct memory as mentioned in the Direct Memory section above.
Text field can cause large memory usage when the field is used for faceting and sorting. Use string field instead of text field in this case.
Monitoring
Monitoring is one of the primary means to keep track of system health. In general, there are four components for good monitoring: key metrics, dashboards, logging and alerts. This blog will go over memory related key metrics and dashboards.
Key Metrics
Here is a list of key metrics to monitor. There metrics are divided into two categories: JVM metrics and cache metrics.
|
Metric Name |
Description |
|
JVM metrics |
|
|
|
JVM heap usage in megabyte |
|
|
JVM direct memory usage in megabyte |
|
|
GC overhead in millisecond per second |
|
|
Number of GC events per second |
|
Cache metrics |
|
|
|
Filter cache hit ratio |
|
|
Field value cache hit ratio |
Jvm_heap_used_mb tells us how much heap Solr is actually using inside JVM. It should go up and down around Solr memory requirement estimation in JVM Heap Size section. Cloudera manager collect one sample per minute. Therefore, the metric may not reflect all memory usage spikes. As mentioned early, make sure there is enough buffer memory inside heap to accommodate sporadic memory usage spike and reduce GC overhead.
Cache hit ratio is another critical metric to monitor. It indicates how many requests out of total queries are satisfied (or partially satisfied) by cache instead of hitting index on disk. Since hitting index is expensive, higher cache hit ratio means more requests are satisfied by cache, which is good for performance. There are more details about cache hit ratio in the Cache Tuning section of blog part 2.
Dashboards
The easiest way to monitor these key metrics are CM dashboards. You can easily build a dashboard using Cloudera Manager for every metric using queries similar to the example below.
select jvm_heap_used_mb where serviceName=SOLR-1
Here is the dashboard created from the query above.
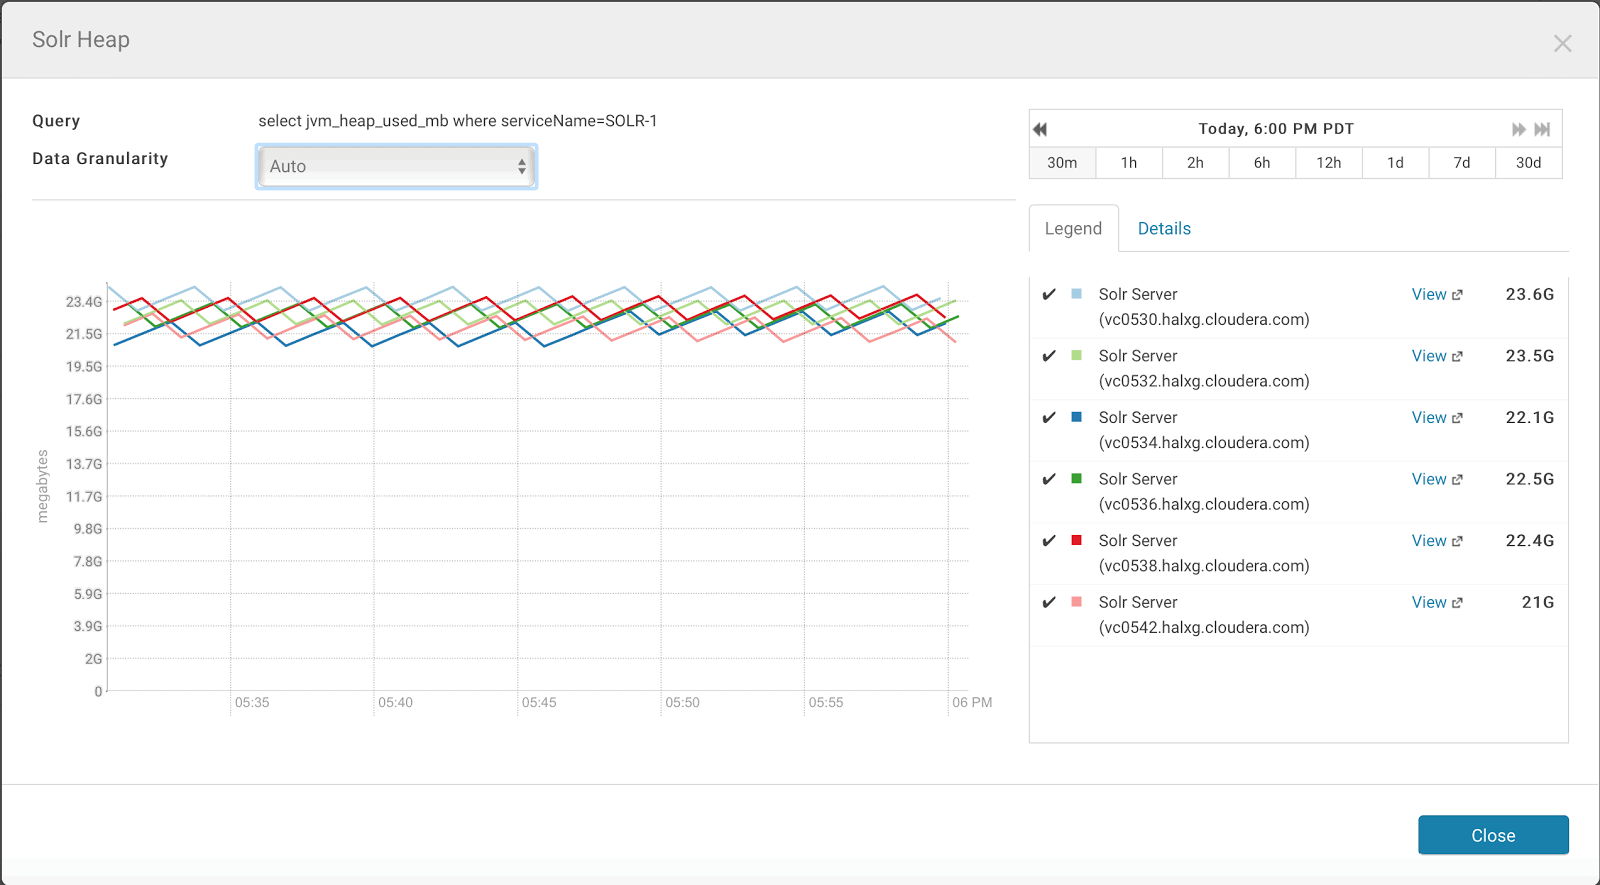
Both real time metric value and long term trend are important. Real time value tells how Solr is performing. Long term trend is a good sign if something is changing in the system, such as workload, index size, etc.
CM dashboard would perform downsample when you look long term trend. For example, if you look at JVM heap usage for 30-day period, the dashboard shows three values, max, min, mean. For JVM heap usage, monitor the max value in addition mean value.
Conclusion
Memory tuning is a critical step when bringing Solr to production. There are many tuning knobs in Solr that can help you setup a stable and performant system. This blog explained general memory tuning techniques, some of these tuning knobs, how to start your first production deployment with a set of configurations that focus on stability. The blog also described Solr memory monitoring, which is critical to make sure your Solr deployment is stable and performant over the time.
Now we have a stable Solr system running. Part 2 of this blog will go deeper to show you how to tune memory to get more out of Solr and how to do GC tuning. There are also best practices described in Part 2.
Michael Sun is a Software Engineer at Cloudera, working on the Cloudera Search team and Apache Solr contributor.
Editor's Choice

