At Cloudera, we believe that Cloudera Manager is the best way to install, configure, manage, and monitor your Apache Hadoop stack. Of course, most users prefer not to take our word for it — they want to know how Cloudera Manager works under the covers, first.
In this post, I’ll explain some of its inner workings.
The Vocabulary of Cloudera Manager
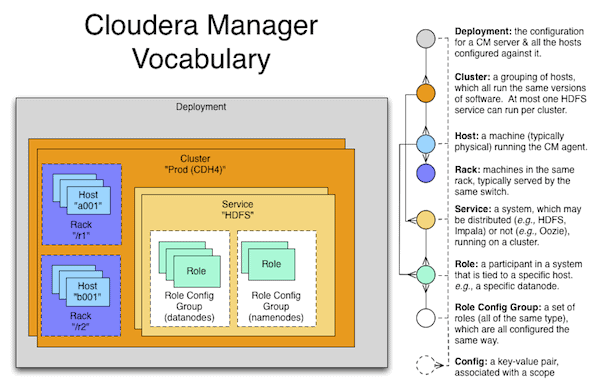
The image below illustrates the basic nouns and relationships of Cloudera Manager:
A “deployment” is the whole shebang, and contains clusters. Clusters are collections of coherent (in the sense that they run the same version of CDH) hosts. Hosts are organized into racks. Services are instances of a specific system, and span many roles, each of which is assigned to a single host. Role config groups are a way of configuring many roles at once, which is the common case.
Configurations are attached to multiple contexts and may cascade, as appropriate. For example, the path where the log files of a DataNode are stored is typically attached to a “Role Config Group,” but it may also be attached to a specific role as an override.
A common point of confusion is the class-type/class-instance nature of “service” as well as “role.” Just like in many programming languages, “string” may indicate either the type (“java.lang.String”) or an instance of that type (“hey there”). We sometimes say “role” to indicate the type (“RegionServer”) or an instance (“the RegionServer on machine17”). When it’s ambiguous, we try to use “role type” and “role instance” to distinguish the two cases. The same thing happens for service (“HBase” or “The Production HBase Service”).
It’s also helpful to always remember this basic principle: Whereas traditionally, multiple services run on one host, in Hadoop — and other distributed systems — a single service runs on many hosts.
Agent/Server Architecture
Cloudera Manager runs a central server (“the Cloudera Manager Server,” which has also been called the “SCM Server” and the “CMF Server” in the past) which hosts the UI Web Server and the application logic for managing CDH. Everything related to installing CDH, configuring services, and starting and stopping services is managed by the Cloudera Manager Server.
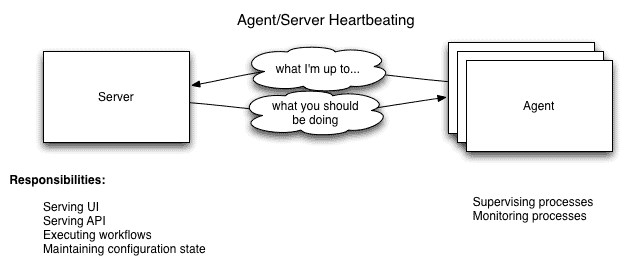
The Cloudera Manager Agents are installed on every managed host. They are responsible for starting and stopping Linux processes, unpacking configurations, triggering various installation paths, and monitoring the host.
Heartbeating
Heartbeats make up the primary communication channel in Cloudera Manager. The agents sends heartbeats (by default) every 15 seconds to the server to find out what the agent should be doing. (There’s an optimization that speeds up heartbeats when things are a-changin’, to reduce user latency.)

The agent, when it’s heartbeating, is saying: “Here’s what I’m up to!” and the server, in its response, is saying, “Here’s what you should be doing.” Both the agent and the server end up doing some reconciliation: If a user has stopped a service via the UI, for example, the agent will stop the relevant processes; if a process failed to start, the server will mark the start command as having failed.
Agent Process Supervision in Detail
One of the agent’s main responsibilities is to start and stop processes. When the agent sees a new process come in from the heartbeat, the agent creates a directory for it in /var/run/cloudera-scm-agent and unpacks the configuration. This is an important point; a Cloudera Manager process never travels alone. A process is more than just the arguments to exec() — it also includes config files, directories that need to be created, and other information (like cgroups settings). This way, there’s never any question about configuration files being out of date.
Giving each process its own private execution and configuration environment allows us to control each process independently, which is crucial for some of the more esoteric configuration scenarios that show up. Here are the contents of an example uniquely-named (that’s what 879 is doing) process directory:
$ tree -a /var/run/cloudera-scm-agent/process/879-hdfs-NAMENODE/
  /var/run/cloudera-scm-agent/process/879-hdfs-NAMENODE/
  ??? cloudera_manager_agent_fencer.py
  ??? cloudera_manager_agent_fencer_secret_key.txt
  ??? cloudera-monitor.properties
  ??? core-site.xml
  ??? dfs_hosts_allow.txt
  ??? dfs_hosts_exclude.txt
  ??? event-filter-rules.json
  ??? hadoop-metrics2.properties
  ??? hdfs.keytab
  ??? hdfs-site.xml
  ??? log4j.properties
  ??? logs
  ?   ??? stderr.log
  ?   ??? stdout.log
  ??? topology.map
  ??? topology.py
To actually start and stop the process, we rely on an open source system called supervisord. It takes care of redirecting log files, notifying us of process failure, setuid’ing to the right user, and so forth.
Cloudera Manager places the “client configuration” for Hadoop in /etc/hadoop/conf. (A similar approach is taken for /etc/hbase/conf and /etc/hive/conf.) That is, by default, if you run a program that needs to talk to Hadoop, it will pick up the addresses of the NameNode and JobTracker, and other important configurations, from that directory. Cloudera Manager makes the distinction between a “client” configuration and a “service” configuration. Settings like the default HDFS replication factor or the heap size of your MapReduce tasks are (somewhat paradoxically) client configurations. Therefore, when those settings are changed, you need to use the “Deploy Client Configuration” action to update these directories.
Processes that Cloudera Manager manages (i.e., the actual daemons like RegionServers and DataNodes and the like) don’t use /etc/hadoop/conf. Instead, they use their own private copy, as described above.This serves two purposes: first, it allows Cloudera Manager to carefully manage the lifecycle of those configurations; second, it makes it clear that the source of truth is the Cloudera Manager server. It would have been unintuitive for Cloudera Manager to override changes in /etc as part of a restart action.
Often users have “edge” or “client” or “gateway” machines, which aren’t running any Hadoop daemons but are on the same network as the cluster. Users use these as a jumping-off point to launch jobs, access the filesystem, etc. If you want to deploy client configurations on these machines, add a “gateway” role onto these machines: they will then receive the configurations when you use “Deploy Client Configuration.”
So who starts the agent? What happens on restart? The agent is typically started by init.d at start-up. It, in turn, contacts the server and figures out what processes should be running. The agent is monitored as part of Cloudera Manager’s host monitoring: if the agent stops heartbeating, the host will be marked as having bad health.
Meanwhile, on the Server…
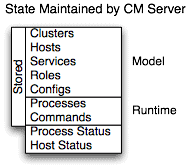
The server maintains the entire state of the cluster. Very roughly, you can divide this into “model” and “runtime” state, both of which are stored in the Cloudera Manager server’s database.

Model State is stuff like what’s supposed to run where, with what configs. That you have 17 hosts, each of which is supposed to run a DataNode, is model state. We’ve modelled the Hadoop stack: its roles, configurations, and interdependencies. The user interacts with the model through the configuration screens (and operations like “Add Service”).
Runtime State is what processes are running where, and what commands (e.g., rebalance HDFS or execute a Backup/Disaster Recovery schedule or rolling restart or plain ol’ stop) are currently being executed. The runtime state includes the nitty-gritty, like the exact configuration files needed to run a process. In fact, when you press “Start” in Cloudera Manager, the server gathers up all the configuration for the relevant services and roles, validates them, and generates the config files, and stores them in the database.
When you update a piece of configuration (say, Hue’s web port), you’ve updated the model. However, if Hue is running while you do this, it’s still listening on the old port. When this kind of mismatch happens, the role is marked as having an “outdated configuration.” To true up, you’ll need to restart the role (which will trigger the configuration re-generation and process restart).
Many users ask us how backup should be done. A simple approach is to use the Cloudera Manager API to grab /api/cm/deployment API endpoint; this captures all the model information but not the runtime information. A second approach is to back up the entire Cloudera Manager server database (which is typically quite small). There is almost nothing to back up on a per-host basis, since the agent’s configuration is typically simply the hostname of the server.
While we try to model all of the reasonable configurations, we found that, inevitably, there are some dark corners that require special handling. To allow our users to workaround, for example, some bug (or, perhaps, to explore unsupported options), we have a “safety valve” which lets users plug in directly to the configuration files. (The analogy, I’ll admit, is oriented toward the developers of Cloudera Manager: We’re “releasing pressure” if the model doesn’t hold up to some real-world oddity.)
Monitoring and Other Management Services
Cloudera Manager itself manages some of its helper services. These include the Activity Monitor, the Service Monitor, the Host Monitor, the Event Server, the Reports Manager, and the Alert Publisher. Cloudera Manager manages each separately (as opposed to rolling them all in as part of the Cloudera Manager Server) for scalability (e.g., on large deployments it’s useful to put the monitors on their own hosts) and isolation.
For this behind-the-scenes blog post, we’ll only look at service monitoring in detail.
Metric Collection
To do its monitoring, Cloudera Manager collects metrics. Metrics are simply numeric values, associated with a name (e.g., “cpu seconds”), an entity they apply to (“host17”), and a timestamp. Most of this metric collection is done by the agent. The agent talks to a supervised process, grabs the metrics, and forwards them to the service monitor. In most cases, this is done once per minute.
A few special metrics are collected by the Service Monitor itself. For example, the Service Monitor hosts an HDFS canary, which tries to write, read, and delete a file from HDFS at regular intervals, and measures not just whether it succeeded, but how long it took. Once metrics are received, they’re aggregated and stored.
Using the Charts page in Cloudera Manager, users can query and explore the metrics being collected. Some metrics (e.g., “total_cpu_seconds”) are counters, and the appropriate way to query them is to take their rate over time, which is why a lot of metrics queries look like “dt0(total_cpu_seconds)”. (The “dt0” syntax is intended to remind you of derivatives. The “0” indicates that since we’re looking at the rate of a monotonically increasing counter, we should never have negative rates.)
Health Checks
The service monitor continually evaluates “health checks” for every entity in the system. A simple one asks whether there’s enough disk space in every NameNode data directory. A more complicated health check may evaluate when the last checkpoint for HDFS was compared to a threshold or whether a DataNode is connected to a NameNode. Some of these health checks also aggregate other health checks: in a distributed system like HDFS, it’s normal to have a few DataNodes down (assuming you’ve got dozens of machines), so we allow for setting thresholds on what percentage of nodes should color the entire service down. Cloudera Manager encapsulates our experience with supporting clusters across our customers by distilling them into these “health checks.”
When health checks go red, events are created, and alerts are fired off via e-mail or SNMP.
One common question is whether monitoring can be separated from configuration. The answer is: No. One of our goals for monitoring is to enable it for our users without needing to do additional configuration and installing additional tools (e.g., Nagios). By having a deep model of the configuration, we’re able to know which directories to monitor, which ports to talk to, and which credentials to use for those ports. This tight coupling means that, when you install Cloudera Standard (the free version of the Cloudera platform), all the monitoring is immediately available.
Any Questions?
I hope that this post has provided a high-level overview of Cloudera Manager internals. If you’ve got any questions, please do ask us. The best place is over on our mailing list, or, if you’re a Cloudera Enterprise customer, via support.
If you’re not already using Cloudera Manager, and are interested in checking it out, see the Cloudera downloads page and the Cloudera Manager documentation page.
Philip Zeyliger is a Software Engineer on the Enterprise team.


Good insights about CM and agent processes. Very well written.