Metrics are collections of information about Hadoop daemons, events and measurements; for example, data nodes collect metrics such as the number of blocks replicated, number of read requests from clients, and so on. For that reason, metrics are an invaluable resource for monitoring Apache Hadoop services and an indispensable tool for debugging system problems.
This blog post focuses on the features and use of the Metrics2 system for Hadoop, which allows multiple metrics output plugins to be used in parallel, supports dynamic reconfiguration of metrics plugins, provides metrics filtering, and allows all metrics to be exported via JMX.
Metrics vs. MapReduce Counters
When speaking about metrics, a question about their relationship to MapReduce counters usually arises. This differences can be described in two ways: First, Hadoop daemons and services are generally the scope for metrics, whereas MapReduce applications are the scope for MapReduce counters (which are collected for MapReduce tasks and aggregated for the whole job). Second, whereas Hadoop administrators are the main audience for metrics, MapReduce users are the audience for MapReduce counters.
Contexts and Prefixes
For organizational purposes metrics are grouped into named contexts – e.g., jvm for java virtual machine metrics or dfs for the distributed file system metric. There are different sets of contexts supported by Hadoop-1 and Hadoop-2; the table below highlights the ones supported for each of them.
| Branch-1 | Branch-2 |
| – jvm – rpc – rpcdetailed – metricssystem – mapred – dfs – ugi |
– yarn – jvm – rpc – rpcdetailed – metricssystem – mapred – dfs – ugi |
A Hadoop daemon collects metrics in several contexts. For example, data nodes collect metrics for the “dfs”, “rpc” and “jvm” contexts. The daemons that collect different metrics in Hadoop (for Hadoop-1 and Hadoop-2) are listed below:
| Branch-1 Daemons/Prefixes | Branch-2 Daemons/Prefixes |
| – namenode – datanode – jobtracker – tasktracker – maptask – reducetask |
– namenode – secondarynamenode – datanode – resourcemanager – nodemanager – mrappmaster – maptask – reducetask |
System Design
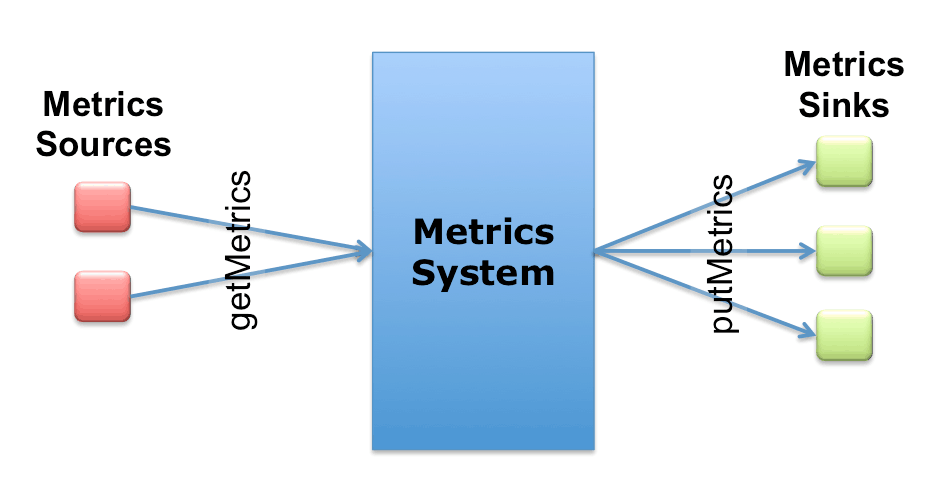
The Metrics2 framework is designed to collect and dispatch per-process metrics to monitor the overall status of the Hadoop system. Producers register the metrics sources with the metrics system, while consumers register the sinks. The framework marshals metrics from sources to sinks based on (per source/sink) configuration options. This design is depicted below.
Here is an example class implementing the MetricsSource:
class MyComponentSource implements MetricsSource {
   @Override
    public void getMetrics(MetricsCollector collector, boolean all) {
    collector.addRecord("MyComponentSource")
             .setContext("MyContext")
              .addGauge(info("MyMetric", "My metric description"), 42);
        }
     }
The “MyMetric” in the listing above could be, for example, the number of open connections for a specific server.
Here is an example class implementing the MetricsSink:
public class MyComponentSink implements MetricsSink {
    public void putMetrics(MetricsRecord record) {
    System.out.print(record);
      }
       public void init(SubsetConfiguration conf) {}
        public void flush() {}
     }
To use the Metric2s framework, the system needs to be initialized and sources and sinks registered. Here is an example initialization:
DefaultMetricsSystem.initialize(”datanode");
MetricsSystem.register(source1, “source1 description”, new MyComponentSource());
MetricsSystem.register(sink2, “sink2 description”, new MyComponentSink())
Configuration and Filtering
The Metrics2 framework uses the PropertiesConfiguration from the apache commons configuration library.
Sinks are specified in a configuration file (e.g., “hadoop-metrics2-test.properties”), as:
test.sink.mysink0.class=com.example.hadoop.metrics.MySink
The configuration syntax is:
[prefix].[source|sink|jmx|].[instance].[option]
In the previous example, test is the prefix and mysink0 is an instance name. DefaultMetricsSystem would try to load hadoop-metrics2-[prefix].properties first, and if not found, try the default hadoop-metrics2.properties in the class path. Note, the [instance] is an arbitrary name to uniquely identify a particular sink instance. The asterisk (*) can be used to specify default options.
Here is an example with inline comments to identify the different configuration sections:
# syntax: [prefix].[source|sink].[instance].[options]
# Here we define a file sink with the instance name “foo”
*.sink.foo.class=org.apache.hadoop.metrics2.sink.FileSink
# Now we specify the filename for every prefix/daemon that is used for
# dumping metrics to this file. Notice each of the following lines is
# associated with one of those prefixes.
namenode.sink.foo.filename=/tmp/namenode-metrics.out
secondarynamenode.sink.foo.filename=/tmp/secondarynamenode-metrics.out
datanode.sink.foo.filename=/tmp/datanode-metrics.out
resourcemanager.sink.foo.filename=/tmp/resourcemanager-metrics.out
nodemanager.sink.foo.filename=/tmp/nodemanager-metrics.out
maptask.sink.foo.filename=/tmp/maptask-metrics.out
reducetask.sink.foo.filename=/tmp/reducetask-metrics.out
mrappmaster.sink.foo.filename=/tmp/mrappmaster-metrics.out
# We here define another file sink with a different instance name “bar”
*.sink.bar.class=org.apache.hadoop.metrics2.sink.FileSink
# The following line specifies the filename for the nodemanager daemon
# associated with this instance. Note that the nodemanager metrics are
# dumped into two different files. Typically you’ll use a different sink type
# (e.g. ganglia), but here having two file sinks for the same daemon can be
# only useful when different filtering strategies are applied to each.
nodemanager.sink.bar.filename=/tmp/nodemanager-metrics-bar.out
Here is an example set of NodeManager metrics that are dumped into the NodeManager sink file:
1349542623843 jvm.JvmMetrics: Context=jvm, ProcessName=NodeManager, SessionId=null, Hostname=ubuntu, MemNonHeapUsedM=11.877365, MemNonHeapCommittedM=18.25, MemHeapUsedM=2.9463196, MemHeapCommittedM=30.5, GcCountCopy=5, GcTimeMillisCopy=28, GcCountMarkSweepCompact=0, GcTimeMillisMarkSweepCompact=0, GcCount=5, GcTimeMillis=28, ThreadsNew=0, ThreadsRunnable=6, ThreadsBlocked=0, ThreadsWaiting=23, ThreadsTimedWaiting=2, ThreadsTerminated=0, LogFatal=0, LogError=0, LogWarn=0, LogInfo=0
1349542623843 yarn.NodeManagerMetrics: Context=yarn, Hostname=ubuntu, AvailableGB=8
1349542623843 ugi.UgiMetrics: Context=ugi, Hostname=ubuntu
1349542623843 mapred.ShuffleMetrics: Context=mapred, Hostname=ubuntu
1349542623844 rpc.rpc: port=42440, Context=rpc, Hostname=ubuntu, NumOpenConnections=0, CallQueueLength=0
1349542623844 rpcdetailed.rpcdetailed: port=42440, Context=rpcdetailed, Hostname=ubuntu
1349542623844 metricssystem.MetricsSystem: Context=metricssystem, Hostname=ubuntu, NumActiveSources=6, NumAllSources=6, NumActiveSinks=1, NumAllSinks=0, SnapshotNumOps=6, SnapshotAvgTime=0.16666666666666669
Each line starts with a time followed by the context and metrics name and the corresponding value for each metric.
Filtering
By default, filtering can be done by source, context, record and metrics. More discussion of different filtering strategies can be found in the Javadoc and wiki.
Example:
mrappmaster.sink.foo.context=jvm
# Define the classname used for filtering
*.source.filter.class=org.apache.hadoop.metrics2.filter.GlobFilter
*.record.filter.class=${*.source.filter.class}
*.metric.filter.class=${*.source.filter.class}
# Filter in any sources with names start with Jvm
nodemanager.*.source.filter.include=Jvm*
# Filter out records with names that matches foo* in the source named "rpc"
nodemanager.source.rpc.record.filter.exclude=foo*
# Filter out metrics with names that matches foo* for sink instance "file" only
nodemanager.sink.foo.metric.filter.exclude=MemHeapUsedM
Conclusion
The Metrics2 system for Hadoop provides a gold mine of real-time and historical data that help monitor and debug problems associated with the Hadoop services and jobs.
Ahmed Radwan is a software engineer at Cloudera, where he contributes to various platform tools and open-source projects.


