

Introduction
Some of the configuration properties found in Apache Hadoop have a direct effect on clients, such as Apache HBase. One of those properties is called “dfs.datanode.max.xcievers”, and belongs to the HDFS subproject. It defines the number of server side threads and – to some extent – sockets used for data connections. Setting this number too low can cause problems as you grow or increase utilization of your cluster. This post will help you to understand what happens between the client and server, and how to determine a reasonable number for this property.
The Problem
Since HBase is storing everything it needs inside HDFS, the hard upper boundary imposed by the “dfs.datanode.max.xcievers” configuration property can result in too few resources being available to HBase, manifesting itself as IOExceptions on either side of the connection. Here is an example from the HBase mailing list [1], where the following messages were initially logged on the RegionServer side:
2008-11-11 19:55:52,451 INFO org.apache.hadoop.dfs.DFSClient: Exception in createBlockOutputStream java.io.IOException: Could not read from stream
2008-11-11 19:55:52,451 INFO org.apache.hadoop.dfs.DFSClient: Abandoning block blk_-5467014108758633036_595771
2008-11-11 19:55:58,455 WARN org.apache.hadoop.dfs.DFSClient: DataStreamer Exception: java.io.IOException: Unable to create new block.
2008-11-11 19:55:58,455 WARN org.apache.hadoop.dfs.DFSClient: Error Recovery for block blk_-5467014108758633036_595771 bad datanode[0]
2008-11-11 19:55:58,482 FATAL org.apache.hadoop.hbase.regionserver.Flusher: Replay of hlog required. Forcing server shutdown
Correlating this with the Hadoop DataNode logs revealed the following entry:
ERROR org.apache.hadoop.dfs.DataNode: DatanodeRegistration(10.10.10.53:50010,storageID=DS-1570581820-10.10.10.53-50010-1224117842339,infoPort=50075, ipcPort=50020):DataXceiver: java.io.IOException: xceiverCount 258 exceeds the limit of concurrent xcievers 256
In this example, the low value of “dfs.datanode.max.xcievers” for the DataNodes caused the entire RegionServer to shut down. This is a really bad situation. Unfortunately, there is no hard-and-fast rule that explains how to compute the required limit. It is commonly advised to raise the number from the default of 256 to something like 4096 (see [1], [2], [3], [4], and [5] for reference). This is done by adding this property to the hdfs-site.xml file of all DataNodes (note that it is misspelled):
<property> <name>dfs.datanode.max.xcievers</name>
<value>4096</value>
</property>
Note: You will need to restart your DataNodes after making this change to the configuration file.
This should help with the above problem, but you still might want to know more about how this all plays together, and what HBase is doing with these resources. We will discuss this in the remainder of this post. But before we do, we need to be clear about why you cannot simply set this number very high, say 64K and be done with it.
There is a reason for an upper boundary, and it is twofold: first, threads need their own stack, which means they occupy memory. For current servers this means 1MB per thread[6] by default. In other words, if you use up all the 4096 DataXceiver threads, you need around 4GB of heap to accommodate them. This cuts into the space you have assigned for memstores and block caches, as well as all the other moving parts of the JVM. In a worst case scenario, you might run into an OutOfMemoryException, and the RegionServer process is toast. You want to set this property to a reasonably high number, but not too high either.
Second, having these many threads active you will also see your CPU becoming increasingly loaded. There will be many context switches happening to handle all the concurrent work, which takes away resources for the real work. As with the concerns about memory, you want the number of threads not grow boundlessly, but provide a reasonable upper boundary – and that is what “dfs.datanode.max.xcievers” is for.
Hadoop File System Details
From the client side, the HDFS library is providing the abstraction called Path. This class represents a file in a file system supported by Hadoop, represented by the FileSystem class. There are a few concrete implementation of the abstract FileSystem class, one of which is the DistributedFileSytem, representing HDFS. This class in turn wraps the actual DFSClient class that handles all interactions with the remote servers, i.e. the NameNode and the many DataNodes.
When a client, such as HBase, opens a file, it does so by, for example, calling the open() or create() methods of the FileSystem class, here the most simplistic incarnations
public DFSInputStream open(String src) throws IOException
public FSDataOutputStream create(Path f) throws IOException
The returned stream instance is what needs a server-side socket and thread, which are used to read and write blocks of data. They form part of the contract to exchange data between the client and server. Note that there are other, RPC-based protocols in use between the various machines, but for the purpose of this discussion they can be ignored.
The stream instance returned is a specialized DFSOutputStream or DFSInputStream class, which handle all of the interaction with the NameNode to figure out where the copies of the blocks reside, and the data communication per block per DataNode.
On the server side, the DataNode wraps an instance of DataXceiverServer, which is the actual class that reads the above configuration key and also throws the above exception when the limit is exceeded.
When the DataNode starts, it creates a thread group and starts the mentioned DataXceiverServer instance like so:
this.threadGroup = new ThreadGroup(“dataXceiverServer”);
this.dataXceiverServer = new Daemon(threadGroup,
new DataXceiverServer(ss, conf, this));
this.threadGroup.setDaemon(true); // auto destroy when empty
Note that the DataXceiverServer thread is already taking up one spot of the thread group. The DataNode also has this internal class to retrieve the number of currently active threads in this group:
/** Number of concurrent xceivers per node. */
int getXceiverCount() {
return threadGroup == null ? 0 : threadGroup.activeCount();
}
Reading and writing blocks, as initiated by the client, causes for a connection to be made, which is wrapped by the DataXceiverServer thread into a DataXceiver instance. During this hand off, a thread is created and registered in the above thread group. So for every active read and write operation a new thread is tracked on the server side. If the count of threads in the group exceeds the configured maximum then the said exception is thrown and recorded in the DataNode’s logs:
if (curXceiverCount > dataXceiverServer.maxXceiverCount) {
throw new IOException(“xceiverCount ” + curXceiverCount
+ ” exceeds the limit of concurrent xcievers ”
+ dataXceiverServer.maxXceiverCount);
}
Implications for Clients
Now, the question is, how does the client reading and writing relate to the server side threads. Before we go into the details though, let’s use the debug information that the DataXceiver class logs when it is created and closed
LOG.debug(“Number of active connections is: ” + datanode.getXceiverCount());
…
LOG.debug(datanode.dnRegistration + “:Number of active connections is: ” + datanode.getXceiverCount());
and monitor during a start of HBase what is logged on the DataNode. For simplicity’s sake this is done on a pseudo distributed setup with a single DataNode and RegionServer instance. The following shows the top of the RegionServer’s status page.
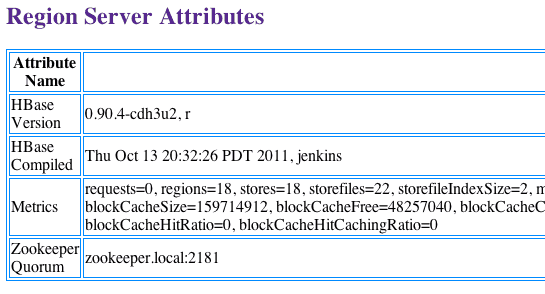
The important part is in the “Metrics” section, where it says “storefiles=22”. So, assuming that HBase has at least that many files to handle, plus some extra files for the write-ahead log, we should see the above logs message state that we have at least 22 “active connections”. Let’s start HBase and check the DataNode and RegionServer log files:
Command Line:
$ bin/start-hbase.sh
…
DataNode Log:
2012-03-05 13:01:35,309 DEBUG org.apache.hadoop.hdfs.server.datanode.DataNode: Number of active connections is: 1
2012-03-05 13:01:35,315 DEBUG org.apache.hadoop.hdfs.server.datanode.DataNode: DatanodeRegistration(127.0.0.1:50010, storageID=DS-1423642448-10.0.0.64-50010-1321352233772, infoPort=50075, ipcPort=50020):Number of active connections is: 2
12/03/05 13:01:35 INFO regionserver.MemStoreFlusher: globalMemStoreLimit=396.7m, globalMemStoreLimitLowMark=347.1m, maxHeap=991.7m
12/03/05 13:01:39 INFO http.HttpServer: Port returned by webServer.getConnectors()[0].getLocalPort() before open() is -1. Opening the listener on 60030
2012-03-05 13:01:40,003 DEBUG org.apache.hadoop.hdfs.server.datanode.DataNode: Number of active connections is: 1
12/03/05 13:01:40 INFO regionserver.HRegionServer: Received request to open region: -ROOT-,,0.70236052
2012-03-05 13:01:40,882 DEBUG org.apache.hadoop.hdfs.server.datanode.DataNode: Number of active connections is: 3
2012-03-05 13:01:40,884 DEBUG org.apache.hadoop.hdfs.server.datanode.DataNode: DatanodeRegistration(127.0.0.1:50010, storageID=DS-1423642448-10.0.0.64-50010-1321352233772, infoPort=50075, ipcPort=50020):Number of active connections is: 4
2012-03-05 13:01:40,888 DEBUG org.apache.hadoop.hdfs.server.datanode.DataNode: Number of active connections is: 3
…
12/03/05 13:01:40 INFO regionserver.HRegion: Onlined -ROOT-,,0.70236052; next sequenceid=63083
2012-03-05 13:01:40,982 DEBUG org.apache.hadoop.hdfs.server.datanode.DataNode: Number of active connections is: 3
2012-03-05 13:01:40,983 DEBUG org.apache.hadoop.hdfs.server.datanode.DataNode: DatanodeRegistration(127.0.0.1:50010, storageID=DS-1423642448-10.0.0.64-50010-1321352233772, infoPort=50075, ipcPort=50020):Number of active connections is: 4
…
12/03/05 13:01:41 INFO regionserver.HRegionServer: Received request to open region: .META.,,1.1028785192
2012-03-05 13:01:41,026 DEBUG org.apache.hadoop.hdfs.server.datanode.DataNode: Number of active connections is: 3
2012-03-05 13:01:41,027 DEBUG org.apache.hadoop.hdfs.server.datanode.DataNode: DatanodeRegistration(127.0.0.1:50010, storageID=DS-1423642448-10.0.0.64-50010-1321352233772, infoPort=50075, ipcPort=50020):Number of active connections is: 4
…
12/03/05 13:01:41 INFO regionserver.HRegion: Onlined .META.,,1.1028785192; next sequenceid=63082
2012-03-05 13:01:41,109 DEBUG org.apache.hadoop.hdfs.server.datanode.DataNode: Number of active connections is: 3
2012-03-05 13:01:41,114 DEBUG org.apache.hadoop.hdfs.server.datanode.DataNode: Number of active connections is: 4
2012-03-05 13:01:41,117 DEBUG org.apache.hadoop.hdfs.server.datanode.DataNode: Number of active connections is: 5
12/03/05 13:01:41 INFO regionserver.HRegionServer: Received request to open 16 region(s)
12/03/05 13:01:41 INFO regionserver.HRegionServer: Received request to open region: usertable,,1330944810191.62a312d67981c86c42b6bc02e6ec7e3f.
12/03/05 13:01:41 INFO regionserver.HRegionServer: Received request to open region: usertable,user1120311784,1330944810191.90d287473fe223f0ddc137020efda25d.
…
2012-03-05 13:01:41,246 DEBUG org.apache.hadoop.hdfs.server.datanode.DataNode: Number of active connections is: 6
2012-03-05 13:01:41,248 DEBUG org.apache.hadoop.hdfs.server.datanode.DataNode: Number of active connections is: 7
…
2012-03-05 13:01:41,257 DEBUG org.apache.hadoop.hdfs.server.datanode.DataNode: DatanodeRegistration(127.0.0.1:50010, storageID=DS-1423642448-10.0.0.64-50010-1321352233772, infoPort=50075, ipcPort=50020):Number of active connections is: 10
2012-03-05 13:01:41,257 DEBUG org.apache.hadoop.hdfs.server.datanode.DataNode: DatanodeRegistration(127.0.0.1:50010, storageID=DS-1423642448-10.0.0.64-50010-1321352233772, infoPort=50075, ipcPort=50020):Number of active connections is: 9
…
12/03/05 13:01:41 INFO regionserver.HRegion: Onlined usertable,user1120311784,1330944810191.90d287473fe223f0ddc137020efda25d.; next sequenceid=62917
12/03/05 13:01:41 INFO regionserver.HRegion: Onlined usertable,,1330944810191.62a312d67981c86c42b6bc02e6ec7e3f.; next sequenceid=62916
…
12/03/05 13:01:41 INFO regionserver.HRegion: Onlined usertable,user1361265841,1330944811370.80663fcf291e3ce00080599964f406ba.; next sequenceid=62919
2012-03-05 13:01:41,474 DEBUG org.apache.hadoop.hdfs.server.datanode.DataNode: Number of active connections is: 6
2012-03-05 13:01:41,491 DEBUG org.apache.hadoop.hdfs.server.datanode.DataNode: Number of active connections is: 7
2012-03-05 13:01:41,495 DEBUG org.apache.hadoop.hdfs.server.datanode.DataNode: DatanodeRegistration(127.0.0.1:50010, storageID=DS-1423642448-10.0.0.64-50010-1321352233772, infoPort=50075, ipcPort=50020):Number of active connections is: 8
2012-03-05 13:01:41,508 DEBUG org.apache.hadoop.hdfs.server.datanode.DataNode: Number of active connections is: 7
…
12/03/05 13:01:41 INFO regionserver.HRegion: Onlined usertable,user1964968041,1330944848231.dd89596e9129e1caa7e07f8a491c9734.; next sequenceid=62920
2012-03-05 13:01:41,618 DEBUG org.apache.hadoop.hdfs.server.datanode.DataNode: Number of active connections is: 6
2012-03-05 13:01:41,621 DEBUG org.apache.hadoop.hdfs.server.datanode.DataNode: DatanodeRegistration(127.0.0.1:50010, storageID=DS-1423642448-10.0.0.64-50010-1321352233772, infoPort=50075, ipcPort=50020):Number of active connections is: 7
…
2012-03-05 13:01:41,829 DEBUG org.apache.hadoop.hdfs.server.datanode.DataNode: DatanodeRegistration(127.0.0.1:50010, storageID=DS-1423642448-10.0.0.64-50010-1321352233772, infoPort=50075, ipcPort=50020):Number of active connections is: 7
12/03/05 13:01:41 INFO regionserver.HRegion: Onlined usertable,user515290649,1330944849739.d23924dc9e9d5891f332c337977af83d.; next sequenceid=62926
2012-03-05 13:01:41,832 DEBUG org.apache.hadoop.hdfs.server.datanode.DataNode: Number of active connections is: 6
2012-03-05 13:01:41,838 DEBUG org.apache.hadoop.hdfs.server.datanode.DataNode: DatanodeRegistration(127.0.0.1:50010, storageID=DS-1423642448-10.0.0.64-50010-1321352233772, infoPort=50075, ipcPort=50020):Number of active connections is: 7
12/03/05 13:01:41 INFO regionserver.HRegion: Onlined usertable,user757669512,1330944850808.cd0d6f16d8ae9cf0c9277f5d6c6c6b9f.; next sequenceid=62929
…
2012-03-05 14:01:39,711 DEBUG org.apache.hadoop.hdfs.server.datanode.DataNode: Number of active connections is: 4
2012-03-05 22:48:41,945 DEBUG org.apache.hadoop.hdfs.server.datanode.DataNode: DatanodeRegistration(127.0.0.1:50010, storageID=DS-1423642448-10.0.0.64-50010-1321352233772, infoPort=50075, ipcPort=50020):Number of active connections is: 4
12/03/05 22:48:41 INFO regionserver.HRegion: Onlined usertable,user757669512,1330944850808.cd0d6f16d8ae9cf0c9277f5d6c6c6b9f.; next sequenceid=62929
2012-03-05 22:48:41,963 DEBUG org.apache.hadoop.hdfs.server.datanode.DataNode: DatanodeRegistration(127.0.0.1:50010, storageID=DS-1423642448-10.0.0.64-50010-1321352233772, infoPort=50075, ipcPort=50020):Number of active connections is: 4
You can see how the regions are opened one after the other, but what you also might notice is that the number of active connections never climbs to 22 – it barely even reaches 10. Why is that? To understand this better, we have to see how files in HDFS map to the server-side DataXceiver’s instance – and the actual threads they represent.
Hadoop Deep Dive
The aforementioned DFSInputStream and DFSOutputStream are really facades around the usual stream concepts. They wrap the client-server communication into these standard Java interfaces, while internally routing the traffic to a selected DataNode – which is the one that holds a copy of the current block. It has the liberty to open and close these connection as needed. As a client reads a file in HDFS, the client library classes switch transparently from block to block, and therefore from DataNode to DataNode, so it has to open and close connections as needed.
The DFSInputStream has an instance of a DFSClient.BlockReader class, that opens the connection to the DataNode. The stream instance calls blockSeekTo() for every call to read() which takes care of opening the connection, if there is none already. Once a block is completely read the connection is closed. Closing the stream has the same effect of course.
The DFSOutputStream has a similar helper class, the DataStreamer. It tracks the connection to the server, which is initiated by the nextBlockOutputStream() method. It has further internal classes that help with writing the block data out, which we omit here for the sake of brevity.
Both writing and reading blocks requires a thread to hold the socket and intermediate data on the server-side, wrapped in the DataXceiver instance. Depending what your client is doing, you will see the number of connections fluctuate around the number of currently accessed files in HDFS.
Back to the HBase riddle above: the reason you do not see up to 22 (and more) connections during the start is that while the regions open, the only required data is the HFile’s info block. This block is read to gain vital details about each file, but then closed again. This means that the server-side resource is released in quick succession. The remaining four connections are harder to determine. You can use JStack to dump all threads on the DataNode, which in this example shows this entry:
“DataXceiver for client /127.0.0.1:64281 [sending block blk_5532741233443227208_4201]” daemon prio=5 tid=7fb96481d000 nid=0x1178b4000 runnable [1178b3000]
java.lang.Thread.State: RUNNABLE
…
“DataXceiver for client /127.0.0.1:64172 [receiving block blk_-2005512129579433420_4199 client=DFSClient_hb_rs_10.0.0.29,60020,1330984111693_1330984118810]” daemon prio=5 tid=7fb966109000 nid=0x1169cb000 runnable [1169ca000]
java.lang.Thread.State: RUNNABLE
…
These are the only DataXceiver entries (in this example), so the count in the thread group is a bit misleading. Recall that the DataXceiverServer daemon thread already accounts for one extra entry, which combined with the two above accounts for the three active connections – which in fact means three active threads. The reason the log states four instead, is that it logs the count from an active thread that is about to finish. So, shortly after the count of four is logged, it is actually one less, i.e. three and hence matching our head count of active threads.
Also note that the internal helper classes, such as the PacketResponder occupy another thread in the group while being active. The JStack output does indicate that fact, listing the thread as such:
“PacketResponder 0 for Block blk_-2005512129579433420_4199” daemon prio=5 tid=7fb96384d000 nid=0x116ace000 in Object.wait() [116acd000]
java.lang.Thread.State: TIMED_WAITING (on object monitor)
at java.lang.Object.wait(Native Method)
at org.apache.hadoop.hdfs.server.datanode.BlockReceiver$PacketResponder \
.lastDataNodeRun(BlockReceiver.java:779)
– locked (a org.apache.hadoop.hdfs.server.datanode.BlockReceiver$PacketResponder)
at org.apache.hadoop.hdfs.server.datanode.BlockReceiver$PacketResponder.run(BlockReceiver.java:870)
at java.lang.Thread.run(Thread.java:680)
This thread is currently in TIMED_WAITING state and is not considered active. That is why the count emitted by the DataXceiver log statements is not including these kind of threads. If they become active due to the client sending sending data, the active thread count will go up again. Another thing to note its that this thread does not need a separate connection, or socket, between the client and the server. The PacketResponder is just a thread on the server side to receive block data and stream it to the next DataNode in the write pipeline.
The Hadoop fsck command also has an option to report what files are currently open for writing:
$ hadoop fsck /hbase -openforwrite
FSCK started by larsgeorge from /10.0.0.29 for path /hbase at Mon Mar 05 22:59:47 CET 2012
……/hbase/.logs/10.0.0.29,60020,1330984111693/10.0.0.29%3A60020.1330984118842 0 bytes, 1 block(s), OPENFORWRITE: ………………………………..Status: HEALTHY
Total size: 2088783626 B
Total dirs: 54
Total files: 45
…
This does not immediately relate to an occupied server-side thread, as these are allocated by block ID. But you can glean from it, that there is one open block for writing. The Hadoop command has additional options to print out the actual files and block ID they are comprised of:
$ hadoop fsck /hbase -files -blocks
FSCK started by larsgeorge from /10.0.0.29 for path /hbase at Tue Mar 06 10:39:50 CET 2012
…
/hbase/.META./1028785192/.tmp <dir>
/hbase/.META./1028785192/info <dir>
/hbase/.META./1028785192/info/4027596949915293355 36517 bytes, 1 block(s): OK
0. blk_5532741233443227208_4201 len=36517 repl=1
…
Status: HEALTHY
Total size: 2088788703 B
Total dirs: 54
Total files: 45 (Files currently being written: 1)
Total blocks (validated): 64 (avg. block size 32637323 B) (Total open file blocks (not validated): 1)
Minimally replicated blocks: 64 (100.0 %)
…
This gives you two things. First, the summary states that there is one open file block at the time the command ran – matching the count reported by the “-openforwrite” option above. Secondly, the list of blocks next to each file lets you match the thread name to the file that contains the block being accessed. In this example the block with the ID “blk_5532741233443227208_4201” is sent from the server to the client, here a RegionServer. This block belongs to the HBase .META. table, as shown by the output of the Hadoop fsck command. The combination of JStack and fsck can serve as a poor mans replacement for lsof (a tool on the Linux command line to “list open files”).
The JStack also reports that there is a DataXceiver thread, with an accompanying PacketResponder, for block ID “blk_-2005512129579433420_4199”, but this ID is missing from the list of blocks reported by fsck. This is because the block is not yet finished and therefore not available to readers. In other words, Hadoop fsck only reports on complete (or synced[7][8], for Hadoop version that support this feature) blocks.
Back to HBase
Opening all the regions does not need as many resources on the server as you would have expected. If you scan the entire HBase table though, you force HBase to read all of the blocks in all HFiles:
HBase Shell:
hbase(main):003:0> scan ‘usertable’
…
1000000 row(s) in 1460.3120 seconds
DataNode Log:
2012-03-05 14:42:20,580 DEBUG org.apache.hadoop.hdfs.server.datanode.DataNode: Number of active connections is: 6
2012-03-05 14:43:23,293 DEBUG org.apache.hadoop.hdfs.server.datanode.DataNode: Number of active connections is: 7
2012-03-05 14:43:23,299 DEBUG org.apache.hadoop.hdfs.server.datanode.DataNode: DatanodeRegistration(127.0.0.1:50010, storageID=DS-1423642448-10.0.0.64-50010-1321352233772, infoPort=50075, ipcPort=50020):Number of active connections is: 8
…
2012-03-05 14:49:24,332 DEBUG org.apache.hadoop.hdfs.server.datanode.DataNode: DatanodeRegistration(127.0.0.1:50010, storageID=DS-1423642448-10.0.0.64-50010-1321352233772, infoPort=50075, ipcPort=50020):Number of active connections is: 11
2012-03-05 14:49:24,332 DEBUG org.apache.hadoop.hdfs.server.datanode.DataNode: Number of active connections is: 10
2012-03-05 14:49:59,987 DEBUG org.apache.hadoop.hdfs.server.datanode.DataNode: Number of active connections is: 11
2012-03-05 14:51:12,603 DEBUG org.apache.hadoop.hdfs.server.datanode.DataNode: DatanodeRegistration(127.0.0.1:50010, storageID=DS-1423642448-10.0.0.64-50010-1321352233772, infoPort=50075, ipcPort=50020):Number of active connections is: 12
2012-03-05 14:51:12,605 DEBUG org.apache.hadoop.hdfs.server.datanode.DataNode: Number of active connections is: 11
2012-03-05 14:51:46,473 DEBUG org.apache.hadoop.hdfs.server.datanode.DataNode: Number of active connections is: 12
…
2012-03-05 14:56:59,420 DEBUG org.apache.hadoop.hdfs.server.datanode.DataNode: Number of active connections is: 15
2012-03-05 14:57:31,722 DEBUG org.apache.hadoop.hdfs.server.datanode.DataNode: Number of active connections is: 16
2012-03-05 14:58:24,909 DEBUG org.apache.hadoop.hdfs.server.datanode.DataNode: DatanodeRegistration(127.0.0.1:50010, storageID=DS-1423642448-10.0.0.64-50010-1321352233772, infoPort=50075, ipcPort=50020):Number of active connections is: 17
2012-03-05 14:58:24,910 DEBUG org.apache.hadoop.hdfs.server.datanode.DataNode: Number of active connections is: 16
…
2012-03-05 15:04:17,688 DEBUG org.apache.hadoop.hdfs.server.datanode.DataNode: Number of active connections is: 21
2012-03-05 15:04:17,689 DEBUG org.apache.hadoop.hdfs.server.datanode.DataNode: DatanodeRegistration(127.0.0.1:50010, storageID=DS-1423642448-10.0.0.64-50010-1321352233772, infoPort=50075, ipcPort=50020):Number of active connections is: 22
2012-03-05 15:04:54,545 DEBUG org.apache.hadoop.hdfs.server.datanode.DataNode: Number of active connections is: 21
2012-03-05 15:05:55,901 DEBUG org.apache.hadoop.hdfs.server.datanode.DataNode: DatanodeRegistration(127.0.0.1:50010, storageID=DS-1423642448-10.0.0.64-50010-1321352233772, infoPort=50075, ipcPort=50020):Number of active connections is: 22
2012-03-05 15:05:55,901 DEBUG org.apache.hadoop.hdfs.server.datanode.DataNode: Number of active connections is: 21
The number of active connections reaches the elusive 22 now. Note that this count already includes the server thread, so we are still a little short of what we could consider the theoretical maximum – based on the number of files HBase has to handle.
What does that all mean?
So, how many “xcievers (sic)” do you need? Given you only use HBase, you could simply monitor the above “storefiles” metric (which you get also through Ganglia or JMX) and add a few percent for intermediate and write-ahead log files. This should work for systems in motion. However, if you were to determine that number on an idle, fully compacted system and assume it is the maximum, you might find this number being too low once you start adding more store files during regular memstore flushes, i.e. as soon as you start to add data to the HBase tables. Or if you also use MapReduce on that same cluster, Flume log aggregation, and so on. You will need to account for those extra files, and, more importantly, open blocks for reading and writing.
Note again that the examples in this post are using a single DataNode, something you will not have on a real cluster. To that end, you will have to divide the total number of store files (as per the HBase metric) by the number of DataNodes you have. If you have, for example, a store file count of 1000, and your cluster has 10 DataNodes, then you should be OK with the default of 256 xceiver threads per DataNode.
The worst case would be the number of all active readers and writers, i.e. those that are currently sending or receiving data. But since this is hard to determine ahead of time, you might want to consider building in a decent reserve. Also, since the writing process needs an extra – although shorter lived – thread (for the PacketResponder) you have to account for that as well. So a reasonable, but rather simplistic formula could be:
![]()
This formula takes into account that you need about two threads for an active writer and another for an active reader. This is then summed up and divided by the number of DataNodes, since you have to specify the “dfs.datanode.max.xcievers” per DataNode.
If you loop back to the HBase RegionServer screenshot above, you saw that there were 22 store files. These are immutable and will only be read, or in other words occupy one thread only. For all memstores that are flushed to disk you need two threads – but only until they are fully written. The files are finalized and closed for good, cleaning up any thread in the process. So these come and go based on your flush frequency. Same goes for compactions, they will read N files and write them into a single new one, then finalize the new file. As for the write-ahead logs, these will occupy a thread once you have started to add data to any table. There is a log file per server, meaning that you can only have twice as many active threads for these files as you have RegionServers.
For a pure HBase setup (HBase plus its own HDFS, with no other user), we can estimate the number of needed DataXceiver’s with the following formula:
![]()
Since you will be hard pressed to determine the active number of store files, flushes, and so on, it might be better to estimate the theoretical maximum instead. This maximum value takes into account that you can only have a single flush and compaction active per region at any time. The maximum number of logs you can have active matches the number of RegionServers, leading us to this formula:
![]()
Obviously, the number of store files will increase over time, and the number of regions typically as well. Same for the numbers of servers, so keep in mind to adjust this number over time. In practice, you can add a buffer of, for example, 20%, as shown in the formula below – in an attempt to not force you to change the value too often.
On the other hand, if you keep the number of regions fixed per server[9], and rather split them manually, while adding new servers as you grow, you should be able to keep this configuration property stable for each server.
Final Advice & TL;DR
Here is the final formula you want to use:
![]()
It computes the maximum number of threads needed, based on your current HBase vitals (no. of store files, regions, and region servers). It also adds a fudge factor of 20% to give you room for growth. Keep an eye on the numbers on a regular basis and adjust the value as needed. You might want to use Nagios with appropriate checks to warn you when any of the vitals goes over a certain percentage of change.
Note: Please make sure you also adjust the number of file handles your process is allowed to use accordingly[10]. This affects the number of sockets you can use, and if that number is too low (default is often 1024), you will get connection issues first.
Finally, the engineering devil on one of your shoulders should already have started to snicker about how horribly non-Erlang-y this is, and how you should use an event driven approach, possibly using Akka with Scala[11] – if you want to stay within the JVM world. Bear in mind though that the clever developers in the community share the same thoughts and have already started to discuss various approaches[12][13].
Links:
- [1] http://old.nabble.com/Re%3A-xceiverCount-257-exceeds-the-limit-of-concurrent-xcievers-256-p20469958.html
- [2] http://ccgtech.blogspot.com/2010/02/hadoop-hdfs-deceived-by-xciever.html
- [3] https://issues.apache.org/jira/browse/HDFS-1861 “Rename dfs.datanode.max.xcievers and bump its default value”
- [4] https://issues.apache.org/jira/browse/HDFS-1866 “Document dfs.datanode.max.transfer.threads in hdfs-default.xml”
- [5] http://hbase.apache.org/book.html#dfs.datanode.max.xcievers
- [6] http://www.oracle.com/technetwork/java/hotspotfaq-138619.html#threads_oom
- [7] https://issues.apache.org/jira/browse/HDFS-200 “In HDFS, sync() not yet guarantees data available to the new readers”
- [8] https://issues.apache.org/jira/browse/HDFS-265 “Revisit append”
- [9] http://search-hadoop.com/m/CBBoV3z24H1 “HBase, mail # user – region size/count per regionserver”
- [10] http://hbase.apache.org/book.html#ulimit “ulimit and nproc”
- [11] http://akka.io/ “Akka”
- [12] https://issues.apache.org/jira/browse/HDFS-223 “Asynchronous IO Handling in Hadoop and HDFS”
- [13] https://issues.apache.org/jira/browse/HDFS-918 “Use single Selector and small thread pool to replace many instances of BlockSender for reads”
Editor's Choice

