

Data scientists and machine learning engineers in enterprise organizations need to fully understand their data in order to properly analyze it, build models, and power machine learning use cases across their business. Due to the lack of tooling specifically designed for data discovery, exploration, and preliminary analysis, this presents a significant challenge for these teams.
When it comes to the early stages in the data science process, data scientists often find themselves jumping between a wide range of tooling. First of all, there’s the question of what data is currently available within their organization, where it is, and how it can be accessed. Data scientists might want to do some SQL–based profiling, or visualize the data to better understand the distributions, veracity, and hidden nuances. After completing these steps, they might need more or even different data altogether, and thus start the process all over again.
Data scientists are likely to use a variety of different tools to move through their processes. It could be a homespun version of PostgreSQL on their local machine for exploring structured data sets; to visualize, they could be writing code or using a BI tool like Tableau or PowerBI. When tooling sprawl occurs, it leads to friction within the data science team that makes collaboration challenging and slows down development.
In the latest release of Cloudera Machine Learning (CML), we now have new functionality to solve the problems in the early stages of the data science process. The new data discovery and visualization feature provides integrated SQL, data visualization, and data discovery tooling built right into the platform and accessible directly from data science and ML project spaces.
In the remainder of this blog, we’re going to dive right into how you can use the new data discovery and visualization features. If you’re using CML May or a later version you will be able to follow the below steps to see the new functionality in action; if you haven’t upgraded we highly recommend upgrading as soon as possible (read this to find out how to upgrade your workspace).
Let’s see this in action
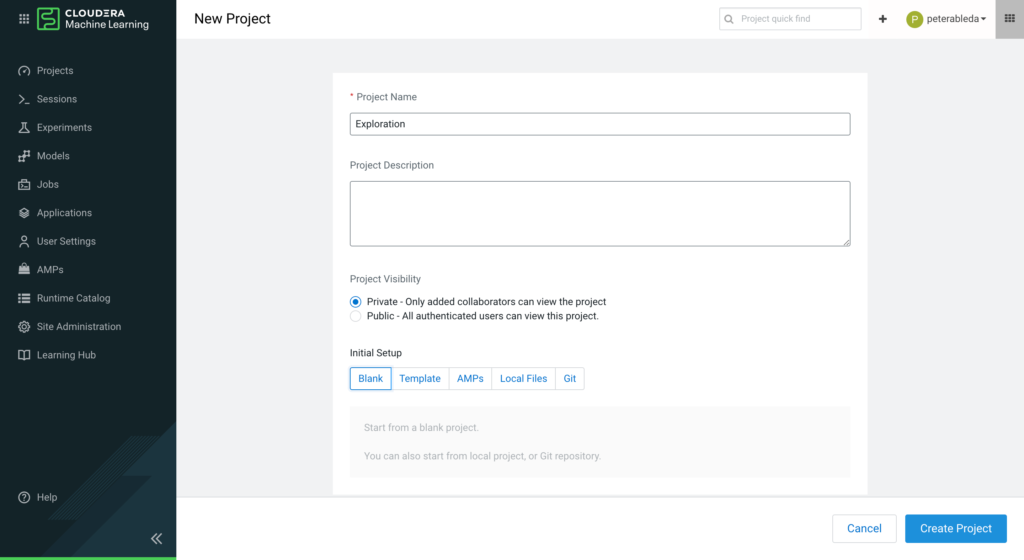
The first step is to create a new project in CML.
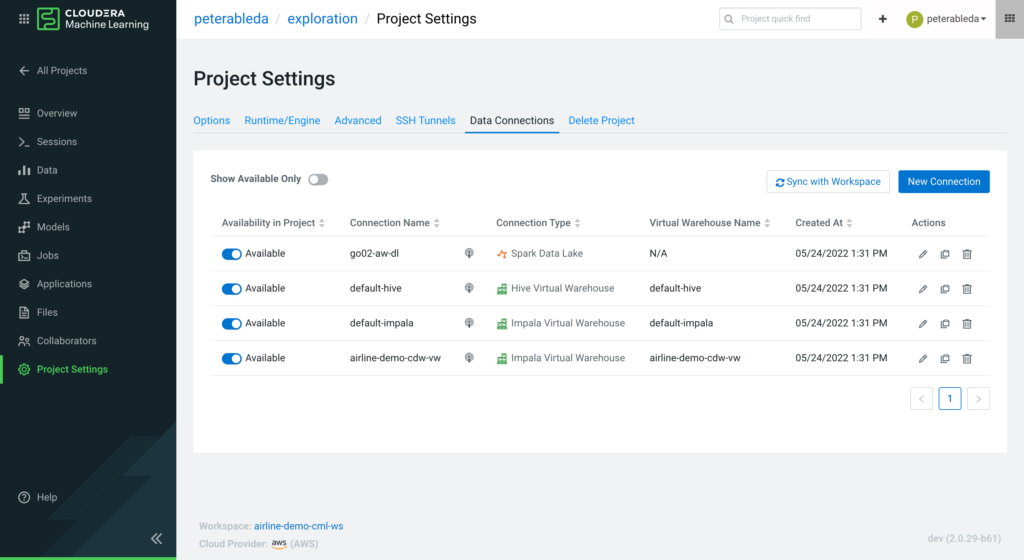
On the Project Settings > Data Connections tab, data scientists can review the connections that are pre-populated for all new projects. The Spark, Impala, and Hive virtual warehouse connections are auto-discovered in the CDP environment or created by administrators so data scientists can start on their use case.
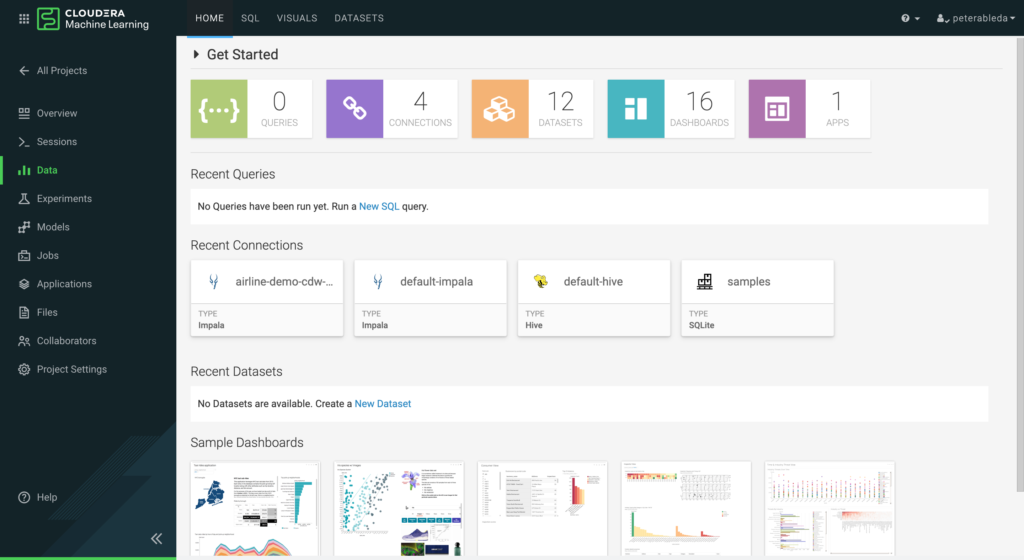
Clicking on Data in the left column, data scientists have access to the data discovery and visualization experience where they can run queries via the built-in SQL interface and build visual dashboards via a drag-and-drop toolkit.
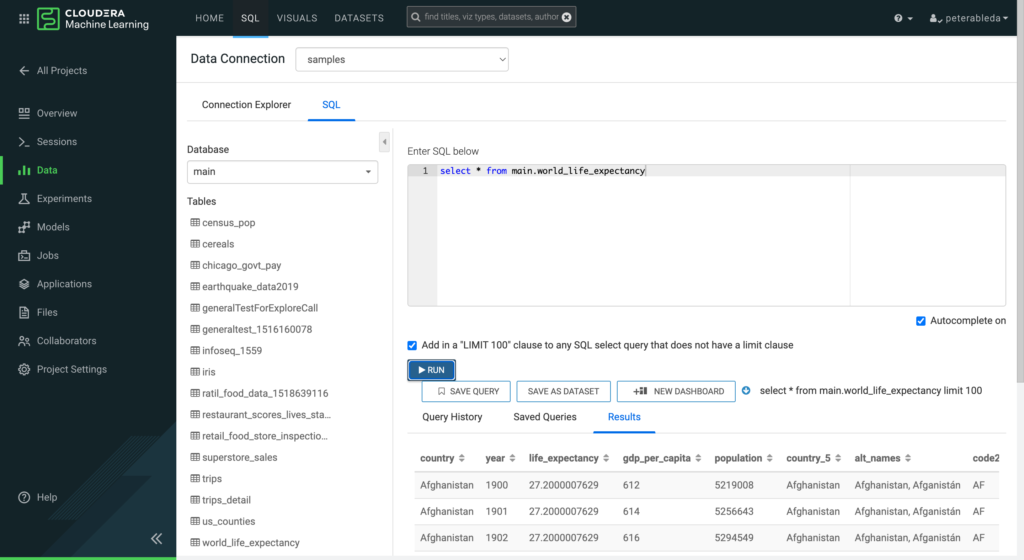
In the SQL tab, data scientists can run queries to build a basic understanding of the data they are working with, and can understand the basic shape and size of their data.
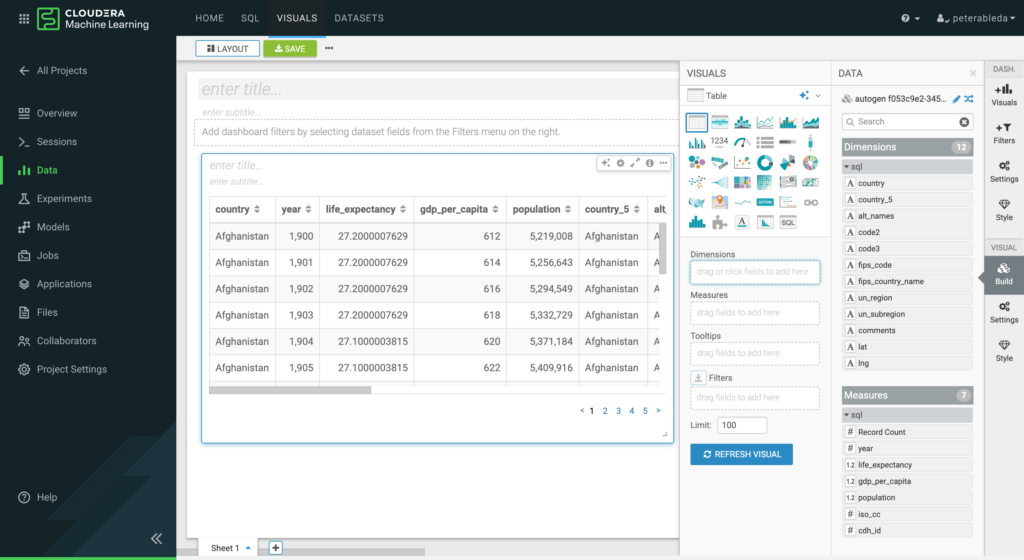
By selecting NEW DASHBOARD the executed SQL query is carried over to the visual dashboard and the data is presented in a default table view.
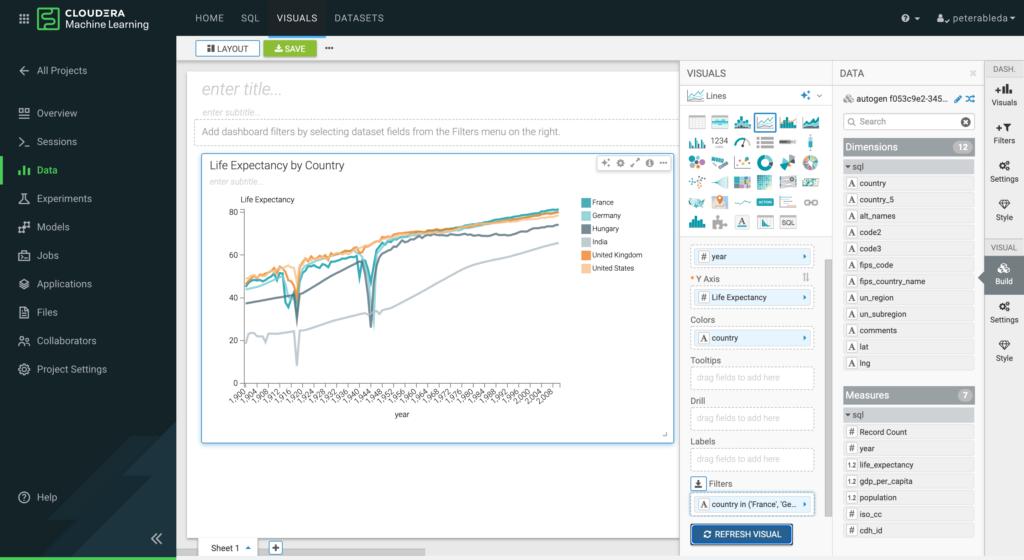
Data scientists can build more complex visuals by selecting Dimension or measure attributes and dragging them onto the different axis, colors, or filter fields of the selected visual type.
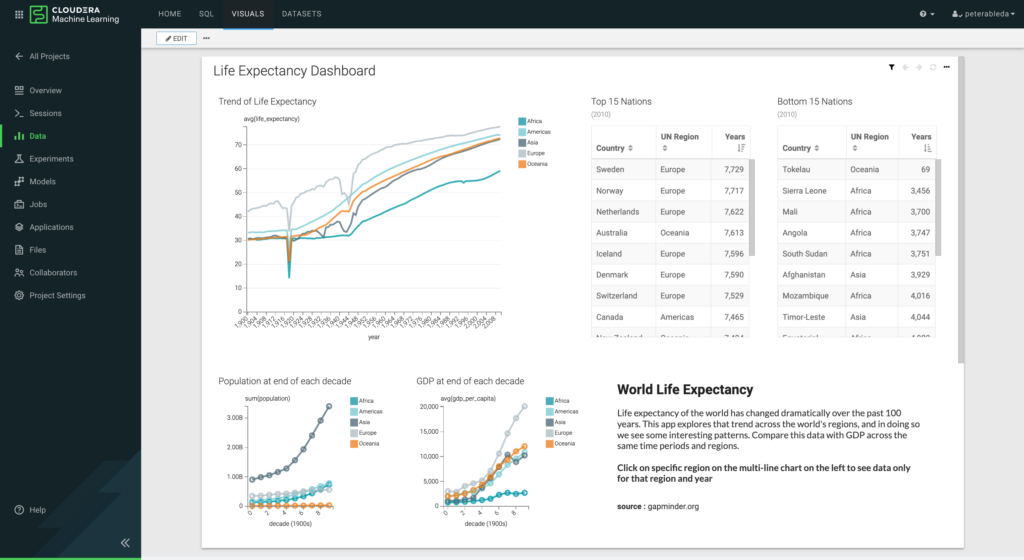
Data scientists can build complex dashboards to share their exploration results with their teams and business stakeholders.
After the visual exploration, data scientists have a solid understanding of the data they are working with and they are ready for the next steps of the machine learning workflow. They can start building and training their models by selecting Sessions in the left column and starting a new session with their favorite editor.
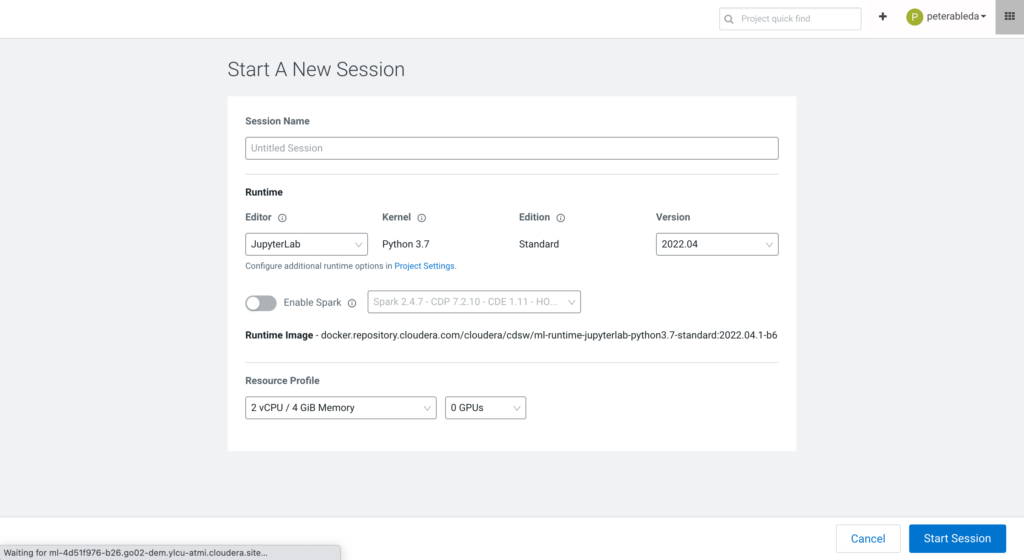
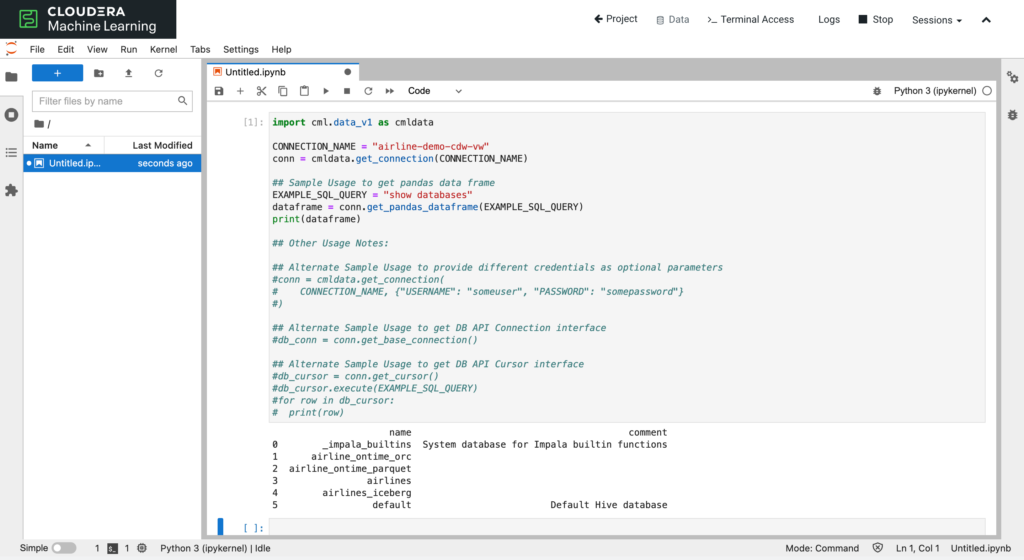
Once the session starts, CML shows the data connections from the project and offers snippets to create a connection. Data scientists can fetch the same data that they built their visual dashboards on.
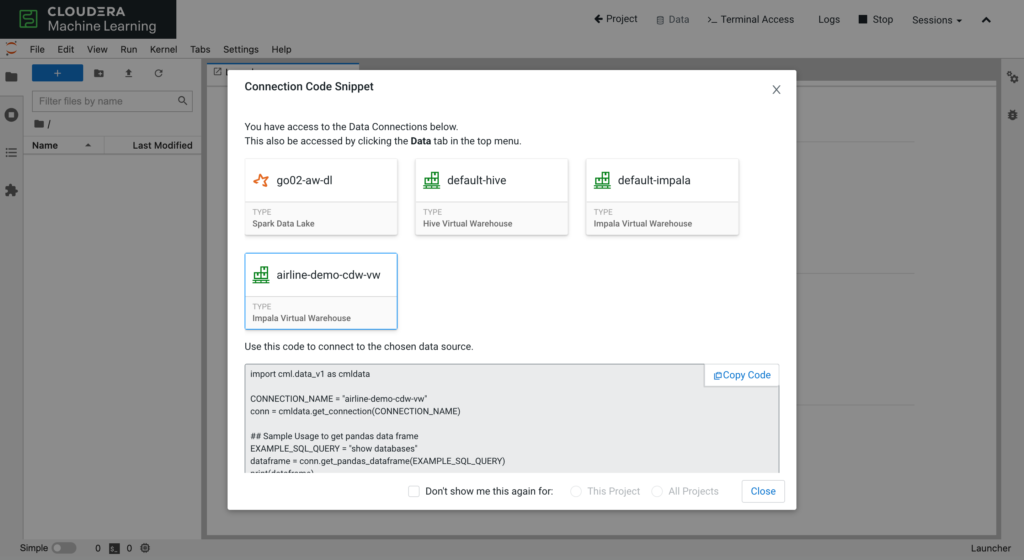
In a CML session the new cml.data library is preloaded to take away the complexity of initiating a connection and to give abstractions on fetching a dataset.
CML’s new exploratory data science experience speeds up the development process by cutting down the time spent on finding, understanding, and accessing the data with integrated data connections and SQL and visual dashboarding tools. Data scientists now can focus on providing business value by building AI applications.
Next Steps
If you want to learn more about everything that CML has to offer and see these features in action, we’ll give you the keys and let you take the whole platform out for a test drive.
To learn more about how CML and CDP can help enable data scientists to discover and explore data sets across their business, read How to Build a Foundation for Exploratory Data Science.
Editor's Choice

