


Since the release of Cloudera Data Visualization (DV) back in Oct 2020, our primary mission has been to expand access to data analytics and predictive insights across enterprise businesses. Since that launch, we’ve worked tirelessly to deliver best-in-class data visualization, dashboarding, and predictive applications capabilities across our cloud and on-premises infrastructures through Cloudera’s machine learning and data warehousing products — all without additional costs, moving data or purchasing any third-party tooling.
CDV is natively integrated with CDP, enabling direct access to data from anywhere with the ability to quickly power visual data discovery and exploration across the entire analytical and machine learning lifecycle.
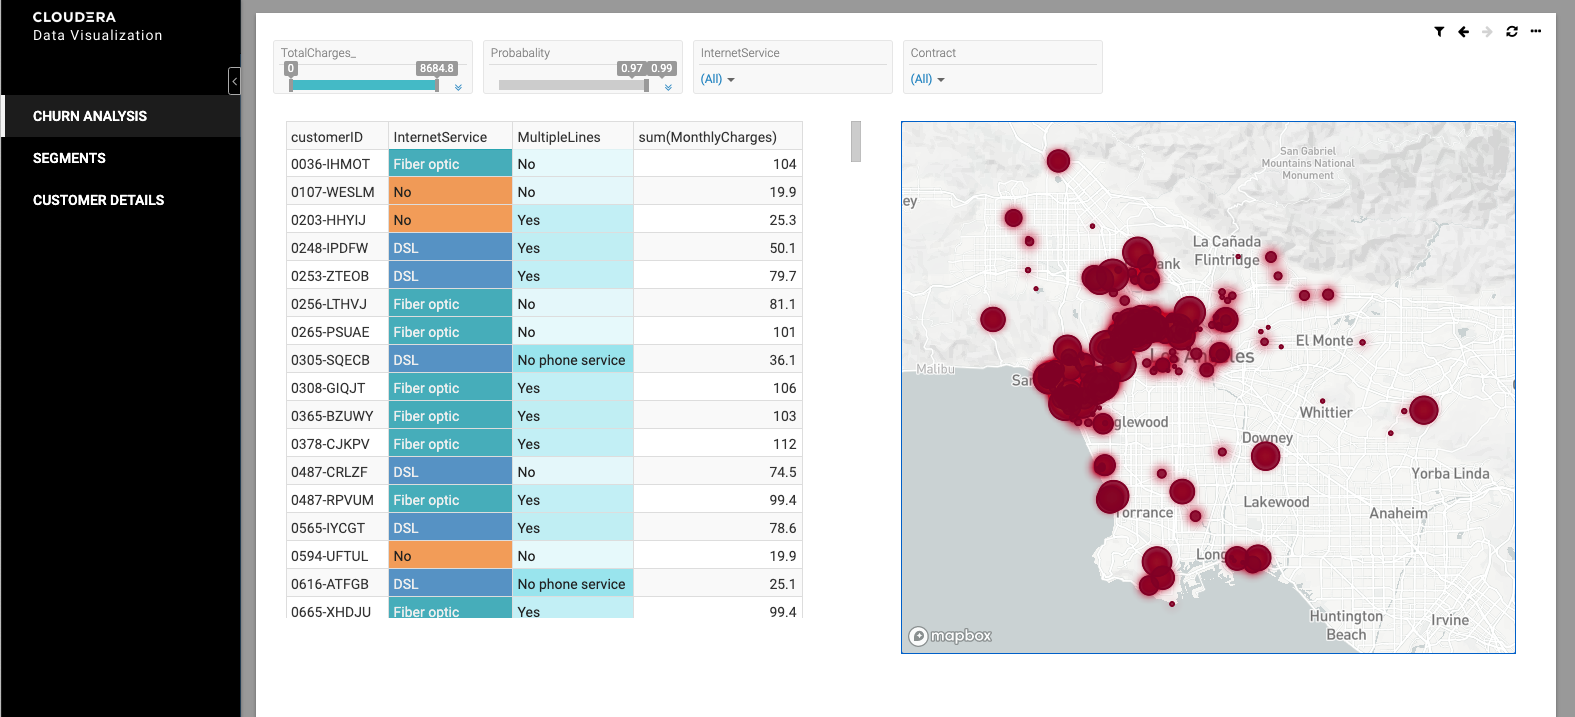
Figure 1: Example menu-driven application within Cloudera Data Visualization, left panel menu allows navigation across multiple dashboards. Dynamic
Building on these innovations and continuing to push the boundaries of data democratization, we’re excited to announce new AI-powered features in Cloudera Data Visualization — Natural Language Search and Visual Recommendations. The new search interface brings business teams even closer to the analytic and machine learning workflows, making it easier than ever for stakeholders and decision-makers to ask questions of their data and immediately get actionable answers they can make decisions from. With today’s continuously exploding data, this level of agility and speed is critical to elevating your data-driven decision-making and keeping a competitive edge.
Figure 2: Cloudera Data Visualization’s new Natural Language Search interface
Simplifying Data Exploration
With Cloudera’s new Natural Language Search capabilities, users can quickly examine relationships within their data by asking simple questions in plain english. These questions are processed, then automatically visualized using an assortment of visualization types best suited for the type of data and question asked. Additionally, users can create a variety of charts by specifying the fields they’re interested in and “exploring” the data through a rich catalog of relevant visual types.
In addition to enabling unprecedented levels of agility, users can dig deeply into their data by specifying a number of criteria such as whether they’re interested in the “top” or “bottom” values, they can sort and highlight the most extreme values. They can also enable natural filtering on specific fields through the dataset’s search modeling interface.
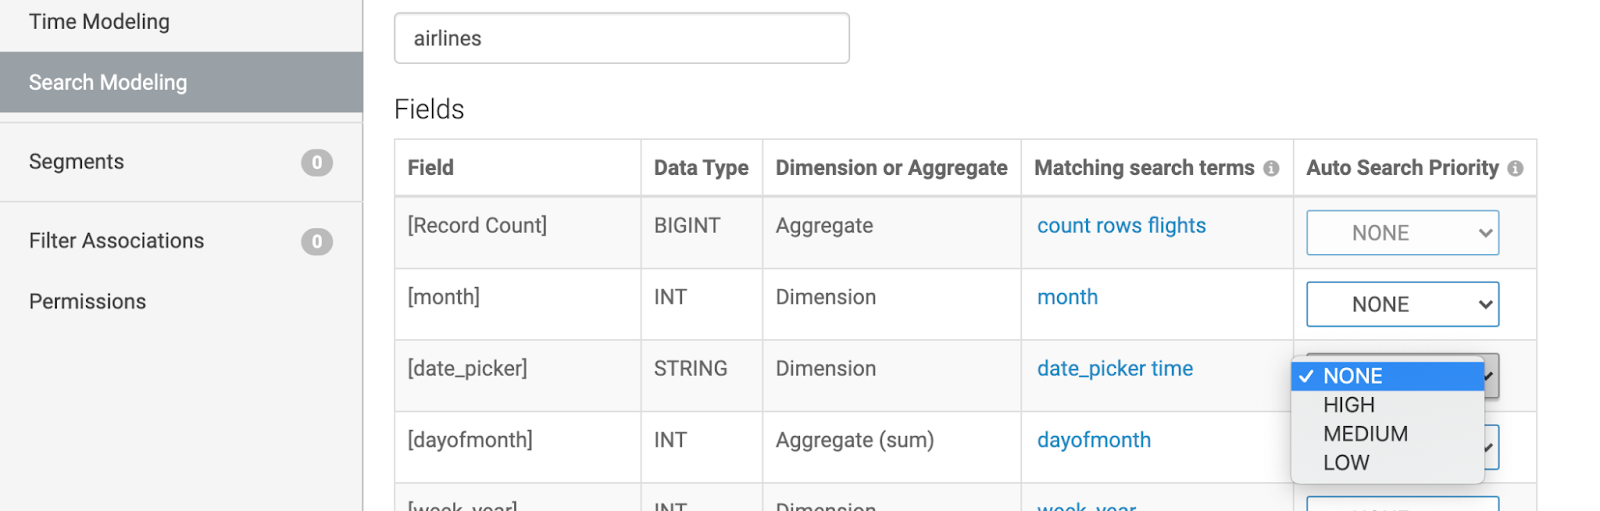
Figure 3: Implicit Search Priority
On datasets with dates, time modeling enables time series analysis. The user can focus on the specific date range they’re interested in, aggregated intervals they want with just a couple of words. Keywords like “trend” and phrases such as “last X years” are translated to visuals with time-based axis and pre-filtered for the correct time intervals.
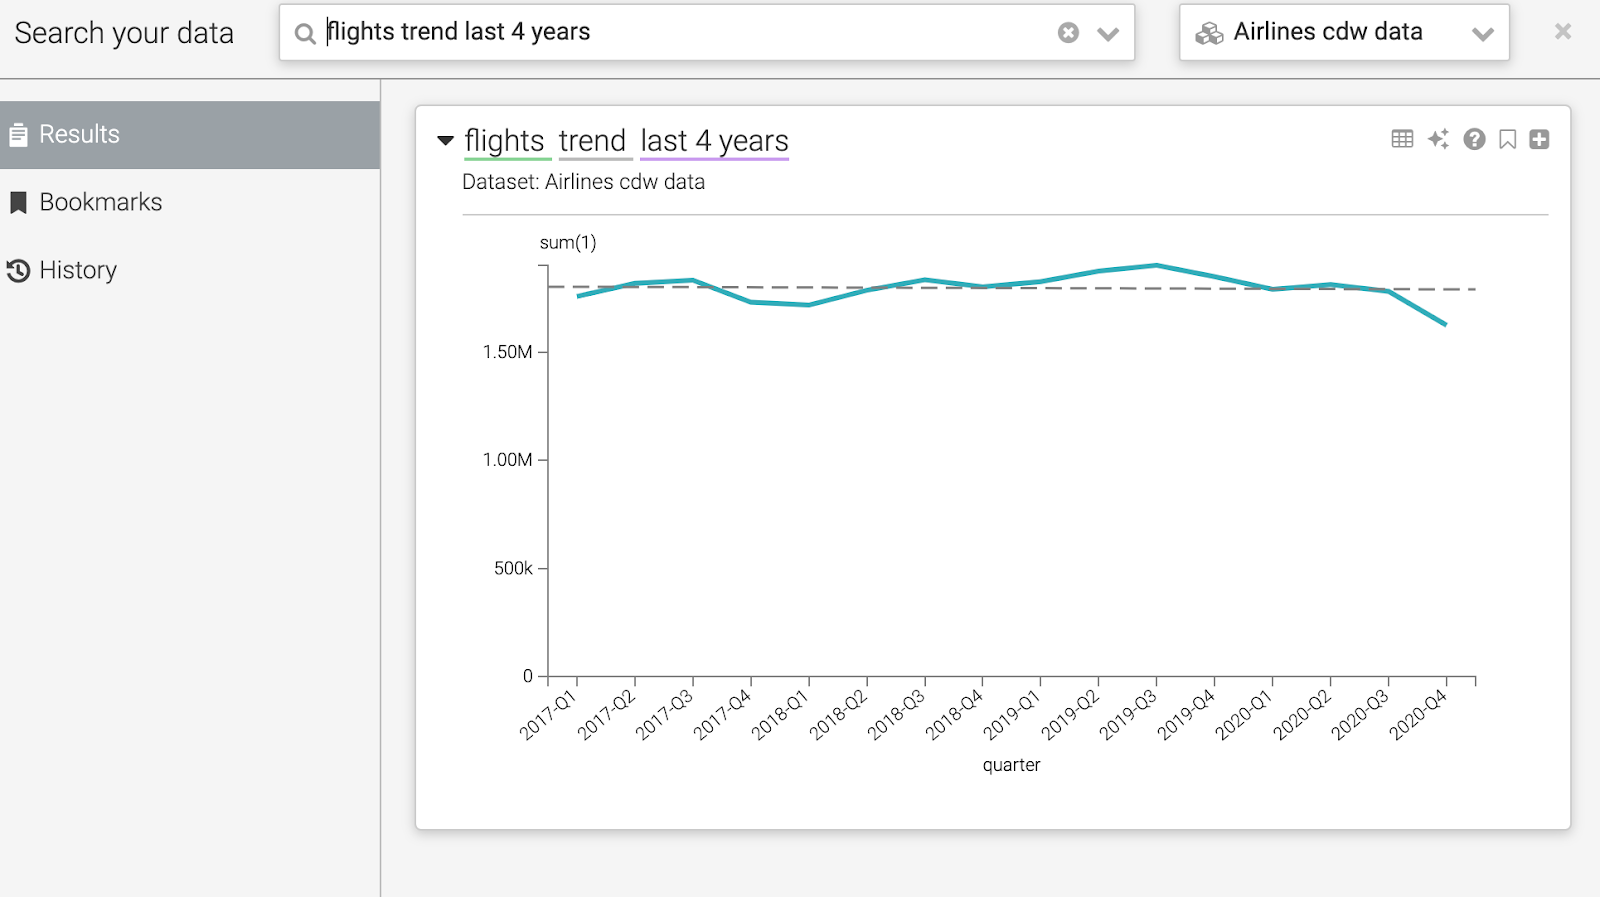
Figure 4: Time modeling enables time series analysis
If the search capabilities uncover actionable insights the business can use, the data being visualized can always be saved and exported for further analysis. Even the underlying rows for a specific segment of the visualization can be examined through the context menu.
Speed Up Insights
Not only can search be used to explore data, but searches can also be turned into templates for quickly building out dashboards and apps to share insights across the business.
Any visuals created through search can be customized on the spot by interacting with the visual’s title. The final visual can be added to existing or new dashboards, where they can be fine-tuned with a simple point & click interface.
When creating new visuals from a search-enabled dataset in a dashboard, users will also be able to directly create a visual using search rather than manually selecting the visual types and fields through the visual builder.
What’s Next?
With Cloudera Data Visualization, business analysts, users, and decision-makers can more easily than ever make their data actionable without writing any code or going through manual workflows. DV’s new Natural Language Search capabilities deliver best-in-class tooling for solving mission-critical problems across the business without moving data or the need to purchase third-party tools. To learn more about Cloudera Data Visualization, register for our Elevate Intelligent Reporting with Natural Language Search webinar.
Editor's Choice

