

This framework based on Apache Flume, Apache Spark Streaming, and Apache Impala (incubating) can detect and report on abnormal bad HTTP requests within seconds.
Website performance and availability are mission-critical for companies of all types and sizes, not just those with a revenue stream directly tied to the web. Web pages can become unavailable for many reasons, including overburdened backing data stores or content-management systems or a delay in load times of third-party content such as advertisements. In addition to the deterioration of user experience during such incidents, search engines quickly apply a significant ranking penalty to slowly loading pages that contain certain keywords. Therefore, apart from determining the root cause of page-load performance or inaccessibility after the fact, detecting problems as they occur—before long-term damage occurs—is an emerging key requirement.
meinestadt.de, a digital media company that serves localized information for cities and towns across Germany,
maintains a converged database of web-server access logs for the purpose of optimizing website performance and minimizing the SEO penalty of slow page loads. Going further, meinestadt.de recently began to use a Cloudera-powered enterprise data hub to detect and report errors as they happen in near-real time.
In this post, I’ll briefly describe how meinestadt.de achieved this goal with Flume, Spark Streaming, and Impala being the main architectural components. Then, I’ll explain how to build a similar solution based on that architecture using sample data.
Use Case and Design
meinestadt.de web servers generate up to 20 million user sessions per day, which can easily result in up to several thousand HTTP GET requests per second during peak times (and expected to scale to much higher volumes in the future). Although there is a permanent fraction of bad requests, at times the number of bad requests jumps.
The meinestadt.de approach is to use a Spark Streaming application to feed an Impala table every n minutes with the current counts of HTTP status codes within the n minutes window. Analysts and engineers query the table via standard BI tools to detect bad requests.
Figure 1 below illustrates the design of this framework, which we will use in this post along with sample data as the basis of an example app:
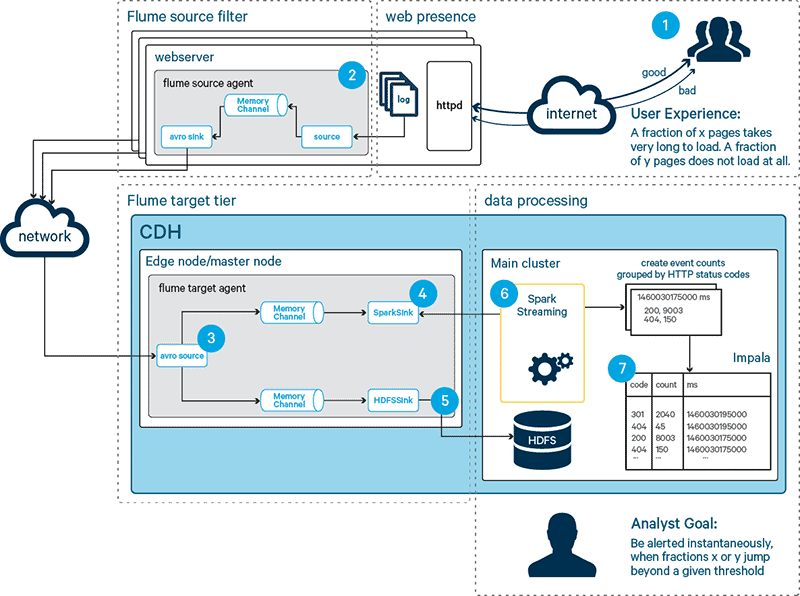
Figure 1: Solution design
Next, let’s look at how to build the example.
Event Format
In this solution, an event is defined as one line of log data in the Common Log Format used by the httpd web server. The sample data used can be obtained freely via http://ita.ee.lbl.gov/html/contrib/NASA-HTTP.html). This format is usually augmented for specific use cases and implementations, so your log entries may not look exactly like the following example:
163.205.2.105 -- [20/Jul/1995:07:37:17 -0400] "GET /images/NASA-logosmall.gif HTTP/1.0" 200 786
Flume
As indicated in Figure 1, in this framework events collection is distributed across web servers and consolidated on Hadoop edge nodes, which also run a set of Flume agents. In such a two-tiered Flume ingestion pipeline, a Flume agent is executed on each web server to extract the log events from httpd. These Flume agents are referred to as the source tier, which is depicted as Step 2 in Figure 1. A second tier of agents, the target tier, executes on the Hadoop cluster. Initially, the events are persisted to HDFS for retrospective analysis, as per Step 5 in Figure 1, and all events are replicated to a Spark Streaming application via a special Flume sink (a SparkSink), shown as Step 4. Initially, the augmented Flume target tier is executed on a single node only. (I’ll cover high availability in the target tier later.)
Spark Streaming
The aforementioned Spark Streaming application, shown in Step 6 in Figure 1, permanently executes on the cluster. Its goal is to capture and count all events over given windows of time and thereby detect a sudden influx of errors in near real-time.
Spark Streaming is responsible for:
- Consuming all log events from Flume and adding them to a discretized stream of events in micro-batches of several seconds.
- After a configurable amount of minutes, counting all event occurrences grouped by status code.
- Persisting the results to Impala.
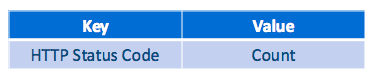
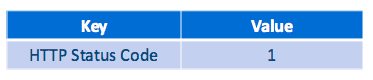
The disjoint windows of time are created on top of a Spark DStream. We want to exhibit an influx by the number of occurrences of bad status codes jumping above a certain threshold across one or more windows. Spark Streaming implements the aforementioned windowing functionality and populates such windows with micro-batches of events. We then count all the occurrences of status codes during a given window and group them by status code, resulting in a list of key-value pairs:
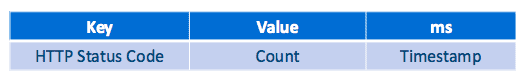
For each window, Spark Streaming constructs the corresponding list of key value pairs. Each entry in this list represents the amount of events with a given status code that occurred between the start time and end time of that window. As results are persisted to HDFS, each such key-value pair is marked with the end-time of its window, resulting in the following record format:
Spark Streaming tracks which events belong in a given window, and the start and end times of all windows, to fulfill the criterion of the windows representing disjoint events.
Using Impala
An Impala table persists the event data for at least 24 hours and makes it accessible in seconds (near real time). Spark Streaming adds a list of records in the format introduced above as a new file in HDFS such that Impala views the file as new content of the results table (see Step 7 in Figure 1).
Implementation
Now it’s time to implement our design. This section provides details and reusable building blocks about the implementation.
Flume in Your Cluster
We use a pull-based approach to connect Spark Streaming to Flume, in which the Spark Streaming receiver uses transactions to obtain events from an org.apache.spark.streaming.flume.sink.SparkSink as introduced in http://spark.apache.org/docs/latest/streaming-flume-integration.html. This sink is contained in the CDH parcel under /opt/cloudera/parcels/CDH/lib/flume-ng/lib/spark-streaming-flume-sink_2.10-1.5.0-cdh5.5.2.jar.
The configuration segments below lists relevant parts from the Flume configuration to achieve the configuration depicted in Figure 1. We start with the definition of two channels; note that we increase the transaction capacity of the channel used to feed the Spark sink.
## Source writes to 2 channels, one for each sink
httpd_production_accesslog_collector.channels = mc1 mc2

httpd_production_accesslog_collector.channels.mc1.type = memory
httpd_production_accesslog_collector.channels.mc1.capacity = 300000

httpd_production_accesslog_collector.channels.mc2.type = memory
httpd_production_accesslog_collector.channels.mc2.capacity = 1000000
httpd_production_accesslog_collector.channels.mc2.transactionCapacity = 1000
An Apache Avro source communicates with the source tier and replicates its events into two channels.
httpd_production_accesslog_collector.sources = AvroIn
httpd_production_accesslog_collector.sources.AvroIn.type = avro
httpd_production_accesslog_collector.sources.AvroIn.bind = 0.0.0.0
httpd_production_accesslog_collector.sources.AvroIn.port = 4550
httpd_production_accesslog_collector.sources.AvroIn.channels = mc1 mc2
Per Figure 1, we define two sinks: one to persist all event data to HDFS, and one for the near real-time use-case.
httpd_production_accesslog_collector.sinks = HadoopOut spark
For brevity, I’ll describe only the Spark sink definition below and omit the HDFS sink. The definition of the Spark sink is straightforward: an interface to which to bind via the FQDN as well as a port for listening.
## Spark pull sink
httpd_production_accesslog_collector.sinks.spark.type = org.apache.spark.streaming.flume.sink.SparkSink
httpd_production_accesslog_collector.sinks.spark.hostname = yourHost.fq.dn
httpd_production_accesslog_collector.sinks.spark.port = 7777
httpd_production_accesslog_collector.sinks.spark.channel = mc2
Flume Test Harness
For the purposes of testing, we can simulate real-time events by using a mock agent.

Figure 2: Flume mock agent for testing
The exec source executes the Linux tail command to listen for new events. After that, the agent is set up in an equivalent manner to the target cluster configuration; a script generates bursts by copying events from the original log file to that which the exec source is listening.
The listing below shows the configuration for the Flume test harness. Note that the Flume exec source is not recommended for use in productive environments (see also https://flume.apache.org/FlumeUserGuide.html#exec-source).
myAgent.sources = apache_server
myAgent.sources.apache_server.type = exec
myAgent.sources.apache_server.command = tail -f /your/path/ErrorsNRT/file_that_flume_tails_on
myAgent.sources.apache_server.batchSize = 1000
myAgent.sources.apache_server.channels = myMemoryChannel

# http://flume.apache.org/FlumeUserGuide.html#memory-channel
myAgent.channels = myMemoryChannel
myAgent.channels.myMemoryChannel.type = memory
myAgent.channels.myMemoryChannel.capacity = 20000
myAgent.channels.myMemoryChannel.transactionCapacity = 1000

## Send to sink that spark streaming pulls on
myAgent.sinks = spark1
myAgent.sinks.spark1.type = org.apache.spark.streaming.flume.sink.SparkSink
myAgent.sinks.spark1.hostname = yourHost.fq.dn
myAgent.sinks.spark1.port = 7777
myAgent.sinks.spark1.channel = myMemoryChannel
Spark Streaming Flow
Figure 3 illustrates the Spark Streaming program flow.

Figure 3: Detailed view of the processing of event data
Note the following phases:
- The Spark Streaming receiver gets individual events from the Flume sink. We are not concerned with the receiver’s internal methodology at this point; we will revisit the receiver’s behavior later to highlight potential optimization regarding HA.
- We create a subtype of DStream (
FlumeUtils.PollingStream), which creates a new micro batch every n seconds. - Spark Streaming and Spark transformations are done to:
- Extract the HTTP status code from an event. This is achieved via a
mapfunction and custom extraction method (more on that below). - Every n seconds, count all status code occurrences, grouped by status code. We then combine batches of these aggregates marked with the creation time of the batch. This is achieved via a Spark Streaming transformation that combines windowing and reduce functionality called
reduceByKeyAndWindow(see below).
- Extract the HTTP status code from an event. This is achieved via a
Parameters
The scopt package simplifies the creation of command-line parameters. The following parameters are made available:

Table 1: Main application parameters
As we want to create windows of events that are disjoint, it is important to set slideSeconds and windowSeconds to the same value to conform to the given requirements.
Creating Micro-batches
Let’s start by creating a discretized stream of events from the Flume events via the following code:
val flumeStream = FlumeUtils.createPollingStream(
  ssc,
  myConfig.flumeHost,
  myConfig.flumePort
)
The resulting DStream is a set of RDDs that are managed by Spark.
As an optional feature of the Spark Streaming application, we may want to extract the complete event body and prefix it with the status code in addition to the counted aggregates.
val microBatch = flumeStream.map(e => (new String(new Interrogator().
  getStatusCode(new String(e.event.getBody.array()))).toInt,
  new String(e.event.getBody.array()))
)
For this, we map each event to a function getStatusCode that extracts the status code from the event body and additionally extracts the full event body. The results of the map function are key-value pairs of the form
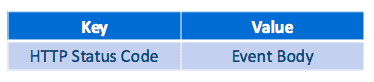
The complete DStream can be persisted to HDFS by the saveAsTextFiles method. In the instance illustrated below, we apply a configurable window on the DStream, which will save the occurrences during the window’s start and end time in a folder named prefix-TIME_IN_MS[.suffix], where TIME_IN_MS is the end-time of the window. The window function consolidates a large amount of micro-batches, such that the output file will contain more events than invoking saveAsTextFiles directly on the original DStream, producing larger output files, which is more desirable for bulk analysis of the event data.
val reportedBatch = microBatch.window(
  Seconds(windowSeconds), Seconds(slideSeconds))
  reportedBatch.saveAsTextFiles(outfile.getAbsolutePath)
Extracting the Status Code
To encapsulate the program code to extract the status code from the events to Spark’s executors, we define a class called Interrogator. Each executor uses an anonymous instance of this class in the transformation invoked on the DStream as an ad-hoc mechanism to ship the required code to the Spark executor. The class has to be serializable; all code and data needs to implement serializable or inherit from serializable classes. This concept is known as a closure in Scala.
The Interrogator class initially defines a number of variables that represent regular expressions. If you choose to use this code in your own solution, you may have to adapt the regular expressions and building blocks to your log format.
class Interrogator {

  val httpFlumeHeaderRegex = """.host.[^ ]*. uuid.[^ ]*. timestamp.[^ ]*."""
...
  val validCodeRegex = """[1-5][0-5][0-9]"""
In the getStatusCode method, these regular expressions are used as building blocks to assemble the full regular expression that precisely extracts the HTTP status code.
val list = List (
  ".*",
  validIpORHostnameRegex,
  " ",
  validDateRegex,
  ".* ",
  validReqRegex,
  " ",
  "(" + validCodeRegex + ")" + " .*"
)
val regexUpToStatusCode = list.mkString("")
val it = regexUpToStatusCode.r.findAllIn(body)
If we fail to obtain the status code from the event body, a non-existent status code exposes the error to the reporting layer. Exposing this condition is desirable because the analysts who monitor the reports are informed about the quality of the data. This approach avoids exception handling in the distributed application due to data quality issues.
if(regexUpToStatusCode.r.findAllIn(body).toArray < 1) {
// did not find a match
return "999"
}
it.matchData.next().group(1)
Counting and Windowing Events
As the main feature of the streaming application, we want to count the events and group them by status codes. Similar to the well-known word-count example, we create key-value pairs of the form
to represent a single event that can be easily counted in a successive step. We call this new DStream microAgg, since it represents an aggregate on a micro-batch basis.
val microAgg = flumeStream.map(e => (new String(new Interrogator().
  getStatusCode(new String(e.event.getBody.array()))).toInt,
  1)
)
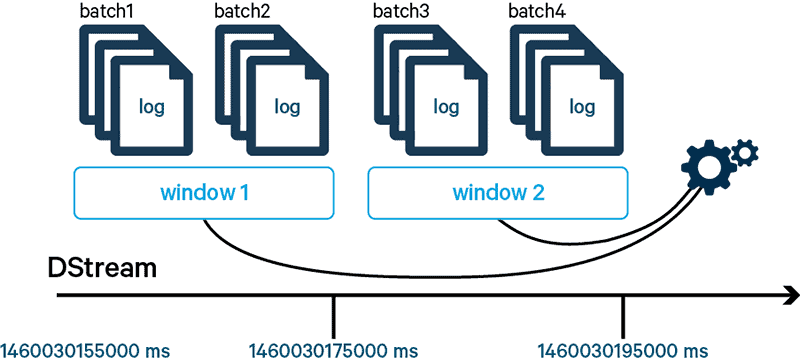
Figure 4: Windowing of log events
The key-value pairs are then reduced by their key and counted. Here we are using the special reduceByKeyAndWindow reduce function from the Spark Streaming package, which creates the windows in the desired format. The reduce functionality of reduceByKeyAndWindow allows us to supply any given aggregate function. In our case, we simply want to sum the events for a specific key in the window. This is done via the addition of any two values from a key-value pair. If our reduce function is invertible, we can use a more efficient version of reduceByKeyAndWindow to determine the events that no longer apply to the current window by specifying the inverse function as a parameter. In our case, this is done by the subtraction of any two values.
According to Figure 4, the correct event counts according to the above semantics can be viewed as
event counts in window1 = sum of all event counts – event counts in (batch3 + batch4)
event counts in window2 = sum of all event counts – event counts in (batch1 + batch2)
The code segment below shows how we use reduceByKeyAndWindow.
val reportedAgg = microAgg.reduceByKeyAndWindow(
  {(a,b) => a + b},
  {(a,b) => a - b},
  Seconds(windowSeconds),
  Seconds(slideSeconds)
)
The new resulting DStream is called reportedAgg, since it is the aggregate that we report to Impala as shown at Step 4 in Figure 3.
Persistence to Impala
To store the results in Impala, we create a destination table and then use Spark Streaming to continuously add data to the destination table at the end of each window.
The destination table is created as displayed in the below DDL statement.
create external table errorsNRT_table (
code string,
counts string,
ms string
)
stored as parquet
location '/your/path/ErrorsNRT/errorsNRT_table';
The code segment below individually saves each RDD contained in the aggregated DStream to HDFS. In contrast to the saveAsTextFiles function introduced above, we process each RDD individually by invoking the foreachRDD method on the DStream. Internally, saveAsTextFiles uses the same foreachRDD function. The benefit we gain from using foreachRDD is that we can directly influence where the data is stored.
val sqlContext = new org.apache.spark.sql.SQLContext(sc)
import sqlContext.implicits._
sqlContext.setConf("spark.sql.parquet.binaryAsString", "true")
reportedAgg.foreachRDD((rdd, time) => {
  println("foreachRDD")
  val rowsDF = rdd.
      filter(x=> x._2 > 0).
    map(x =>
HTTPEvent(
x._1.toString,
x._2.toString,
time.toString().stripSuffix(" ms")
)
    ).toDF()
rowsDF.write.mode(org.apache.spark.sql.SaveMode.Append).save(myConfig.agg)
})
This code yields the effective results record format of (HTTP-code, count, timestamp) introduced before. It does so by simply mapping the all events, i.e. HTTP-code, count tuples along with the current window’s timestamp into a case class instance that is defined earlier in the code:
case class HTTPEvent(code: String, count: String, ms: String))
This will conveniently form one time the triples we aim to store in Impala. We also filter out empty counts via the above filter(x=> x._2 > 0) transformation. Each RDD that is created by foreachRDD is transformed into a new RDD and ultimately turned into a Dataframe via the toDF()method above. The Dataframe can then be easily saved into an Apache Parquet table. Note that by creating the Dataframe on an RDD constructed via the HTTPEvent, we automatically derive the correct schema information for writing the Parquet files.
Querying Results
The current method of storing results in the target Parquet file directly from Spark requires that we make Impala aware of the new content via the refresh statement, which is included in the below SQL query. Use refresh carefully if this table becomes large.
refresh errorsNRT_table;
select * from errorsNRT_table;
+---+----+--------+
| code | counts | ms            |
+---+----+--------+
| 301  | 2040   | 1460030175000 |
| 403  | 17     | 1460030175000 |
| 307  | 51     | 1460030175000 |
| ...  | ...    |               |
+---+----+--------+
Deployment
Maven is used to compile the Spark Streaming application and manage its dependencies. To match the software components used in your current version of CDH, we use the Cloudera Maven repository for all library dependencies. The below code segment lists the matching library dependencies for building our application, which is called ErrorsNRT.
    org.apache.spark
      spark-core_2.10
    1.5.0-cdh5.5.2


    org.apache.spark
    spark-streaming_2.10
    1.5.0-cdh5.5.2


    org.apache.spark
    spark-streaming-flume_2.10
    1.5.0-cdh5.5.2


    com.github.scopt
    scopt_2.10
      3.4.0


      maven-hadoop
      Hadoop Releases
    https://repository.cloudera.com/content/repositories/releases/
We are using the Maven Shade plugin to build a shaded JAR file that contains all direct and transient dependencies, such that no additional JARs need be installed on the cluster. This process can be adapted as needed.
  org.apache.maven.plugins
  maven-shade-plugin
  2.2

    false
      target/ErrorsNRT-shaded.jar


        *:*


        *:*

          META-INF/*.SF
          META-INF/*.DSA
          META-INF/*.RSA


      package

      shade


            reference.conf
Launching
For convenience and to illustrate the usage of the command-line parameters, I’ve provided a shell script, run_ErrorsNRT.sh, to wrap the invocation of ErrorsNRT. The parameter settings in the script conform to the explanation in Table 1 and reflect the settings that are used in the current deployment.
# Runtime parameters to control the tool functions.
#
export YARN_MODE=yarn-client
export TOOLNAME=ErrorsNRT-shaded
export AGG=/your/path/ErrorsNRT/countsRDD
export OUT=/your/path/ErrorsNRT/out/events
export CP=/your/path/ErrorsNRT/checkpoints
export FLUME_HOST=
export FLUME_PORT=7777
export BATCH_SECONDS=15
export SLIDE_SECONDS=300
export WINDOW_SECONDS=300

spark-submit --conf spark.driver.extraClassPath=/etc/hive/conf:/opt/cloudera/parcels/CDH/hive/lib/hive/* \
--conf spark.executor.extraClassPath=/opt/cloudera/parcels/CDH/hive/lib/hive/* \
--jars $PROJECT_HOME/$TOOLNAME.jar \
--master $YARN_MODE ;name ErrorsNRT-$YARN_MODE \
--class de.allesklar.errorsNRT.ErrorsNRT $TOOLNAME.jar \
--slideSeconds $SLIDE_SECONDS \
--windowSeconds $WINDOW_SECONDS \
--batchSeconds $BATCH_SECONDS \
--master $YARN_MODE \
--aggfile $AGG \
--outfile $OUT \
--cpfile $CP \
--flumeHost $FLUME_HOST \
--flumePort $FLUME_PORT \
--verbose true &
Optimization
Options for HA
The following is required to achieve HA:
- Configure the Flume source tier to distribute events across multiple target-tier agents.
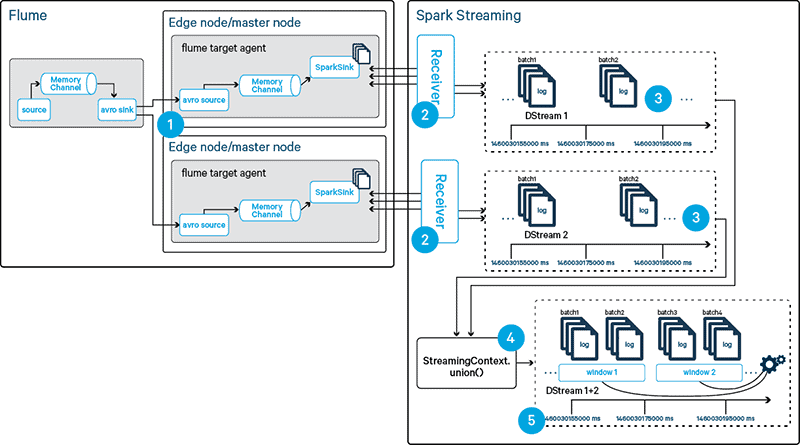
- Provide a failover agent in the Flume target tier as illustrated in Step 1 in Figure 5. Since the Spark sink requires a hostname to bind to, we cannot easily use a single configuration for both instances of the agents. Possible options comprise:
- Use a single hostname alias on both hosts running the Flume agent, which points to the actual IP/FQDN on which the Flume sink will listen for connections from Spark. Use this alias in a single configuration file feeding two instances of the Flume agent.
- Deploy an additional Flume service in Cloudera Manager that has the same configuration except for the Spark sink hostname.
- Provide a failover receiver in Spark Streaming as depicted in Step 2 in Figure 5.
- Since the receiver is created along with the DStream and the specification of the Flume sink’s hostname occurs during the Stream’s instantiation, we would use multiple distinct DStream instances, i.e. one for each Flume agent. These DStreams, which represent a subset of the overall event stream as per Step 3 in Figure 5, can be consolidated into a single DStream again by invoking the
unionmethod on the Streaming Context, shown as Step 4 in Figure 5, which takes a Scala collection of DStreams as its input and creates a DStream containing all events. At this point the program semantics are the same as in the existing application, as illustrated in Step 5 in the same figure.
- Since the receiver is created along with the DStream and the specification of the Flume sink’s hostname occurs during the Stream’s instantiation, we would use multiple distinct DStream instances, i.e. one for each Flume agent. These DStreams, which represent a subset of the overall event stream as per Step 3 in Figure 5, can be consolidated into a single DStream again by invoking the
-
-
Figure 5: Options for HA
The original, single-stream code introduced above needs to be changed only slightly to account for the additional receiver(s) and stream(s). Instead of our prior
flumeStreamwe are now building a sequence of streams, which we then union into aunifiedFlumeStream:val flumeStreams = (0 to (myConfig.numStreams - 1)).map { i => FlumeUtils.createPollingStream( ssc, myConfig.flumeHost, myConfig.flumePort + i) } val unifiedFlumeStream = ssc.union(flumeStreams)Independent of HA, increasing the number receivers in the Spark Streaming application also increases the total amount of possible amount of events that can be consumed in the application. Be careful to maintain the ability of a single Flume agent/Spark stream to process all events in a failover situation; a slow influx of throughput over time may lead to saturating both agents and streams without the operations team being aware.
Flume Test Harness Adaptations for HA
To test the behavior of two union’ed Spark streams, we change our Flume test harness to have two
SparkSinks that take events from the same channel. This is shown in the illustration below.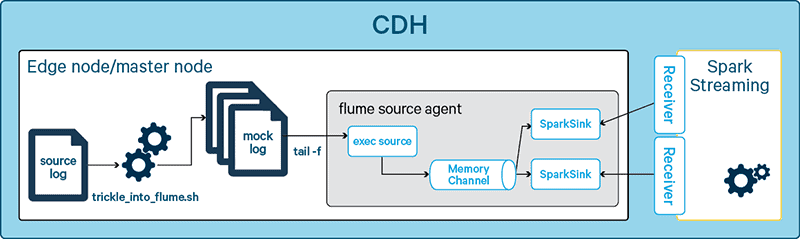
Figure 6: Flume mock-up HA agent
The listing below shows the Flume agent configuration of the mock agent.
myAgent.sources = apache_server
myAgent.sources.apache_server.type = exec
myAgent.sources.apache_server.command = tail -f /your/path/ErrorsNRT/file_that_flume_tails_on
myAgent.sources.apache_server.batchSize = 1000
myAgent.sources.apache_server.channels = myMemoryChannel

# http://flume.apache.org/FlumeUserGuide.html#memory-channel
myAgent.channels = myMemoryChannel
myAgent.channels.myMemoryChannel.type = memory
myAgent.channels.myMemoryChannel.capacity = 20000
myAgent.channels.myMemoryChannel.transactionCapacity = 1000

## Send to sink that spark streaming pulls on
myAgent.sinks = spark1 spark2
myAgent.sinks.spark1.type = org.apache.spark.streaming.flume.sink.SparkSink
myAgent.sinks.spark1.hostname = yourHost.fq.dn
myAgent.sinks.spark1.port = 7777
myAgent.sinks.spark1.channel = myMemoryChannel
myAgent.sinks.spark2.type = org.apache.spark.streaming.flume.sink.SparkSink
myAgent.sinks.spark2.hostname = yourHost.fq.dn
myAgent.sinks.spark2.port = 7778
myAgent.sinks.spark2.channel = myMemoryChannel
The above configuration is allowed behavior in Flume and suffices to simulate the intended behavior. The best practice in this case is to use a group of sinks to be able to directly influence the distribution of events (also see https://flume.apache.org/FlumeUserGuide.html#flume-sink-processors).
Number of partitions for reduceByKeyAndWindow
As a performance optimization it may be beneficial to experiment with the number of partitions of the
reduceByKeyAndWindowfunction, which defaults to 2.Re-partitioning of Input Data Before Processing
To increase the overall throughput of events, use the
repartition(<number of partitions>))method to direct incoming events to a larger amount of executors immediately before any further processing occurs.Conclusion
In this post, I’ve explained how a framework based on meinestadt.de’s solution provides high availability and scalability even for large implementations of web-traffic analysis. The Spark Streaming application involved is fully configurable and only requires around 230 lines of program code.
The source code for all components described here is available at https://github.com/jqnik/ErrorsNRT; the master branch points to the code that runs two Spark sinks and should be used with a corresponding Flume configuration (e.g.
flume/mock-agent.ha.conf). To obtain the code without the HA configuration,git-check-outthe initial commit, one before the current master.Jan Kunigk is a Solutions Architect at Cloudera.

Editor's Choice

