
Most of the day to day work for knowledge workers is spent helping the business make better decisions, like choosing whether it’s worth expending the effort (or actual money) to achieve the desired business goal. The example I often use when talking about ML is churn prediction (and I’m starting to think I’m overusing it now). It costs money to retain a customer who is thinking of moving, but this is less than the cost of getting new customers. If they don’t want to leave, you don’t need to spend the money to keep them. But if they might leave and you spend the money to keep them, then it’s money well spent.
The key here is knowing if your customer intends to leave. Michael Gregory did a great post unpacking the mechanics of calculating the probability of customer churn for telecom customers. This blog is about applying the principles of integrating the outcomes from the deployed models into the business to help you make better decisions.
So let’s switch up and look at a different scenario, one that is not quite as clear cut as churn: wine quality! My colleague Matthiew Lamarisse has built a really great end-to-end project that we use to demo data science and machine learning workflows in CDSW/CML. The premise is to predict whether a wine will be considered of Poor or Excellent quality based on measured values of various chemicals and chemical characteristics in the wine. e.g. pH, sulphates, alcohol percentage etc. The original data set is available here. Matt has changed it slightly for this project to make it a binary classifier (Poor vs Excellent) rather than the 10 different rating levels from the original data set.
As personal aside: I don’t like any wine, so I could build a model that classifies all wines as being of poor quality. It would be very fast and very accurate but of limited use. I have my views on the validity of wine tasting as a “science”. Buy me a beer and I’ll tell you all about it.
If you recall from my post on putting machine learning models into production, there is a general pattern that we see used in ML implementations:
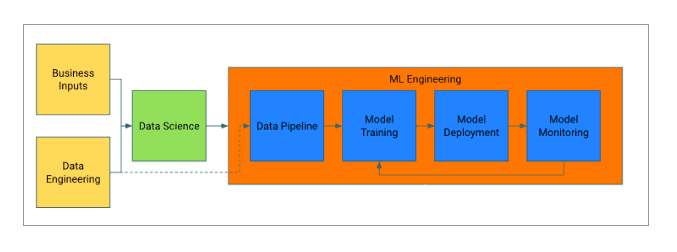
We’ll break this workflow process into several steps, along with the decisions that need to be made at each step. What this article will show is how data science and machine learning can help make better business decisions by providing credible information (not just data) at each step.
This process should be familiar to anyone involved in project management or product development. It’s something I worked within a previous life called the stage-gate process.
Step 1: Business Requirements
Decision: Do we want to try to give our wine a good rating?
Wine quality is judged by an external group of fancy wine people who will determine your wine’s future. If you get an Excellent quality rating, it’s good for business. It’s like Yelp reviews, mostly out of your hands but can make or break your business. So there is clearly a business benefit in trying to produce a wine that will get a good rating. While that seems self-evident – make good wine and people will like it – there is enough subjectivity in wine preferences that it makes this hard to do. I don’t believe the producers of wine that are rated as a poor quality set out with that intent. It’s likely they grew grapes, squashed them, let them sit in a barrel for a bit and shoved the end result under the trained nose of a sommelier only to be disappointed with the outcome.
So if you have the ability to get an indication of what your wine’s judged quality could be, why not aim to make it an excellent wine? That means we have to make the decision to use data science and machine learning to get our wine a better rating.
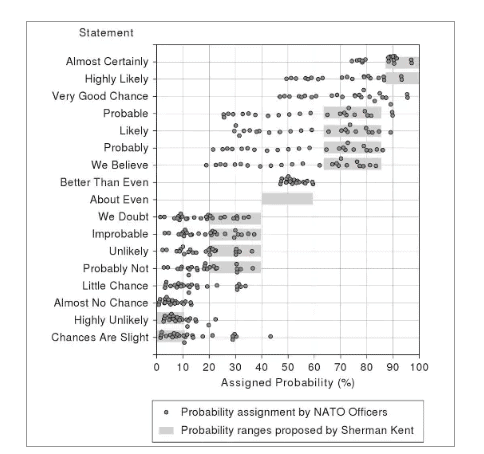
An aside on using the word ‘could’ in the previous paragraph: something that is always going to be a problem with using probabilistic methods to make decisions is that the underlying language is hard to grasp. In a paper by Sherman Kent on the Words of Estimative Probability, he looked at how people will interpret a probability value based statement about the estimate. If I said “we believe we can get our wine a better rating”, it maps to quite a wide range of actual probabilities in how people interpret what I have said. And this is not even taking confidence intervals into account. It’s important to think not just about the actual results but also the way we communicate the results to help all involved make effective decisions.
Step 2: Data Science
Decision: Can we predict if a wine will get a good rating?
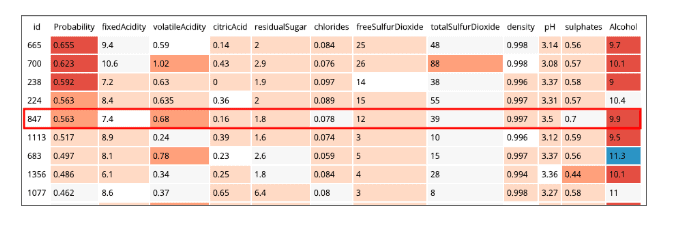
The next step is to work out if this will be possible. Here we start to look at data and the code. Our wine dataset looks something like this:
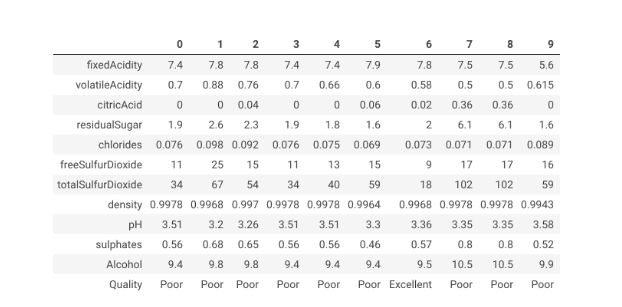
We have just under 1600 wines, all judged and judged hard:
‘Wines total: 1598, Good: 854, Poor: 744’
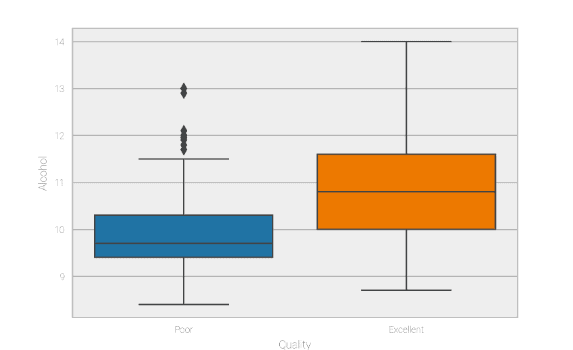
If you run Matt’s code, you can see his fairly detailed analysis of the underlying data. Something that stood out for me is that alcohol levels seem to have a fairly large impact on whether a wine is considered Poor or Excellent quality.
What we end up with is a process to build a binary classifier that can make a prediction about the quality of the wine based on its measured values of various chemicals and chemical characteristics.
The decision we’re making here is whether we can make a prediction about the wine’s quality. We can, but we need to know if that model is any good, that we do in the next step.
Step 3: Model Training
Decision: Is our model accurate and useful?
For such a small dataset with a once-off usage requirement like this, steps 2 and 3 would be done at once. But when working with much larger datasets in environments where the function of model operations is separated from data science, these are 2 separate steps and you would need to make 2 separate decisions.
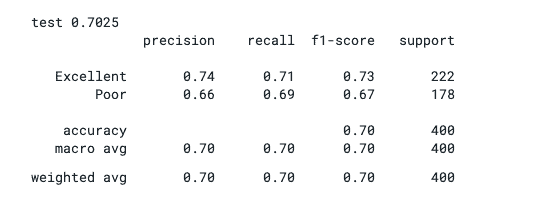
If you run the code, you will see that the model’s precision performance is 70%.

In the context of the Stephen Kent works of estimation discussion, this part is hard. We’ve built a model on a smallish data set, and it seems to perform quite well, but in the absence of good domain knowledge, “quite well” is somewhat meaningless. As a non-wine drinker, I would have no idea if I would trust the results. The data seems to suggest adding alcohol to the wine makes it better, but I have no idea if that is feasible. You need to look at the accuracy measure of the model along with an understanding of the underlying data. If the model was 50% accurate (i.e. as good as random guessing), it would be of no use. However, if it’s 99% accurate based on factors you have no control over it is also not going to be useful.
Given that wine producers can influence the production process and alter a wine’s chemistry, and the model we have that performs well enough, we can say that our model is both accurate and useful. Also, Matt knows wine and he stands by his model. He has stats skills, coding skills, and domain knowledge, so I agree with standing by Matt’s model too.
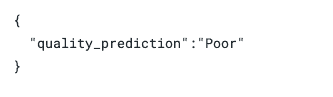
So let’s pick a wine from the list (row number 847) to be the one we have produced and see what the model says. Using the deployed model API as part of the code, we can see that inputting the measured chemical characteristics, i.e. the features…
..gives us a wine that is likely to be judged as being of poor quality.
If we trust the model, which we do, then we need to do something about this, which we do in the next step.
Step 4: Model Deployment
Decision: What can we do to give our wine a higher rating?
Now that we have a trusted model, the next step is to put it into production. In this case, we want to know what we can do to improve our wine’s rating.
The code creates 2 types of models. The first is the standard binary classifier model, the second implements a process to interpret the results from the model using LIME. This is explored in more detail in this blog and this Interpretability report from CFFL which you can find here. What this model does is show you which of your input features had the biggest impact on the predicted output value. For our wine, that looks like:
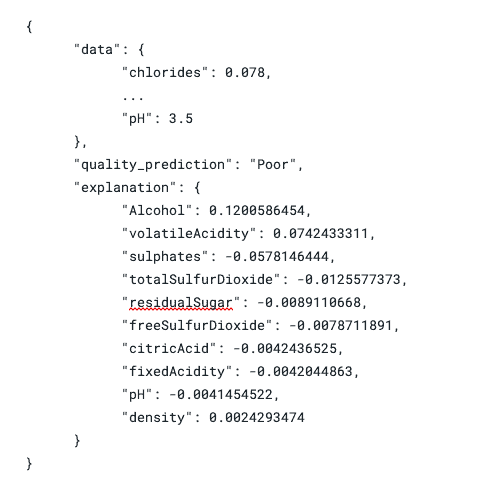
This output format (JSON) is not easy for a human to read through, so the code includes a web application that you can run as a CML Application. It randomly selects wines from the list and runs it through the explainer model and highlights which features have the biggest impact on the predicted probability.
The app also allows you to test different input values to check what impact it has on the predicted output value. Using the app, we can see that changing volatile acidity levels from 0.68 to 0.5 changes the prediction from Poor to Excellent.
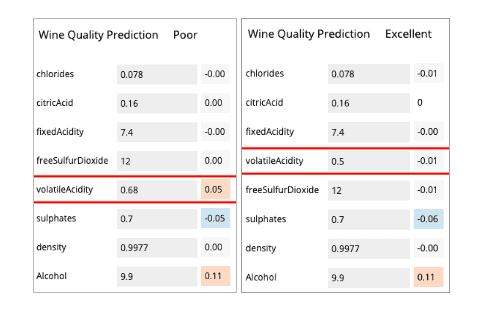
In the winemaking process, changing volatile acidity levels seems super easy, barely an inconvenience. So we should do that.
There are a couple of things to note there though. Firstly this change seems huge, from Poor to Excellent, but actually it’s a change in the probability threshold from over 0.5 to under 0.5, which is the level our dataset uses to classify wines into each category. The original dataset has a bigger range output of categories, so this wine is likely moving from ‘meh’ to ‘okay’. Doing this has not miraculously made a poor quality wine into an excellent quality, we have just given the wine a better chance of being judged as a higher quality wine.
The other consideration is that we chose volatile acidity as the measure to adjust. Alcohol percentage has a much bigger influence on quality prediction. We could have just made the wine stronger, but I’m going to assume that would be harder or more expensive to do.
The decision we need to make is can we do something to give our wine a higher rating, and we have decided that we can. We’ve made a business decision to adjust the manufacturing process to reduce the volatile acidity and it should help your wine get a better quality rating.
Step 5: Model Monitoring
Decision: Does this still apply?
The final step is monitoring your model. As more wines are tested and new quality results are released, you need to test your existing model with the updated data to see how accurate it still is. If the model needs to be retrained to improve its accuracy, you should run your wine against the newly trained model to see how well it fairs and if there are any other changes to the manufacturing process you can make to improve your wines rating. This is a decision you should make regularly.
The perceptive reader would have spotted the causal assumption I made about alcohol levels and quality. Cloudera has some serious wine buffs, so I asked Istvan Foldi, who used to be a sommelier and has actually made wine for an opinion on this.
“Your assumption is correct however, it may not always be the case. Higher alcohol levels can negatively affect the quality and the wine will not taste as good. Also, the remaining alcohol depends on the amount of rest sugar in the original grape juice and can affect the remaining alcohol.”
Making causal assumptions like this is tricky and requires not just good domain knowledge but also a good understanding of the model’s performance over time. Look out for a future CFFL report on causality that will discuss this in-depth.
Conclusion
Making effective use of machine learning and data science techniques in a business context involve so much more than just trying out the latest algorithms on whatever data you have. It’s a process that moves through various stages and you need to ensure you are incorporating what you have learned in the previous step. If it’s centered around a solid business objective, this approach will help achieve the goal.
At Cloudera, we have the tooling in Cloudera Machine Learning and expertise with our Machine Learning Services teams to help you get this right. Speak to us about how we can help you.
Editor's Choice


Nice work Jeff ! Very interesting read…